It is Snippet Wednesday again, and I thought I’d take the opportunity to share my personal little project to make app creation easier: my own TableView!, built on top of the versatile WebView. This snippet demonstrates how to use my TableView and shortly how it was built.
Snippet
For this “snippet”, I created a package that allows any VIKTOR developer to quickly convert a pandas dataframe to a visualization of tabular data, using my TableView. To install the package, you can simply add it to your requirements.txt file:
requirements.txt
viktor==14.4.0
viktor-table-view
Similar to any other view that is available in the VIKTOR SDK, you can add the TableView by adding it as a decorator on your method, and returning a TableResult. Here is an example of an implementation of the TableView:
app.py
import numpy as np
import pandas as pd
from viktor import ViktorController
from viktor_table_view import TableResult
from viktor_table_view import TableView
class SampleEntity(ViktorController):
label = "Le Table"
@TableView("le view", duration_guess=1)
def le_view(self, **kwargs):
# Generate a sample dataframe
data = np.random.randn(20, 6)
strings = np.array(["string1", "string2", "string3", "string4"])
string_data = np.random.choice(strings, size=(20, 4))
# Create the headers of this sample dataframe
headers1 = ["Text"] * 4 + ["Number"] * 6
headers2 = [f"Column {index + 1}" for index in range(0, 10)]
# Combine the headers and data into a dataframe
df = pd.DataFrame(np.column_stack([string_data, data]), columns=[headers1, headers2])
df.iloc[:, 4:] = df.iloc[:, 4:].astype(float)
# Now add colours to the sample dataframe by copying the dataframe and fill with info colours
df_colours = df.copy(deep=True)
df_colours.iloc[0, :] = "success"
df_colours.iloc[1, :] = "warning"
df_colours.iloc[2, :] = "error"
df_colours.iloc[3:, :] = pd.NA
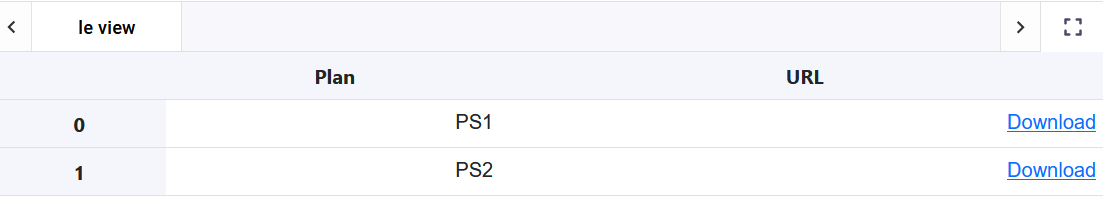
return TableResult(df, dataframe_colours=df_colours, n_decimals={("Number", "Column 5"): 2})
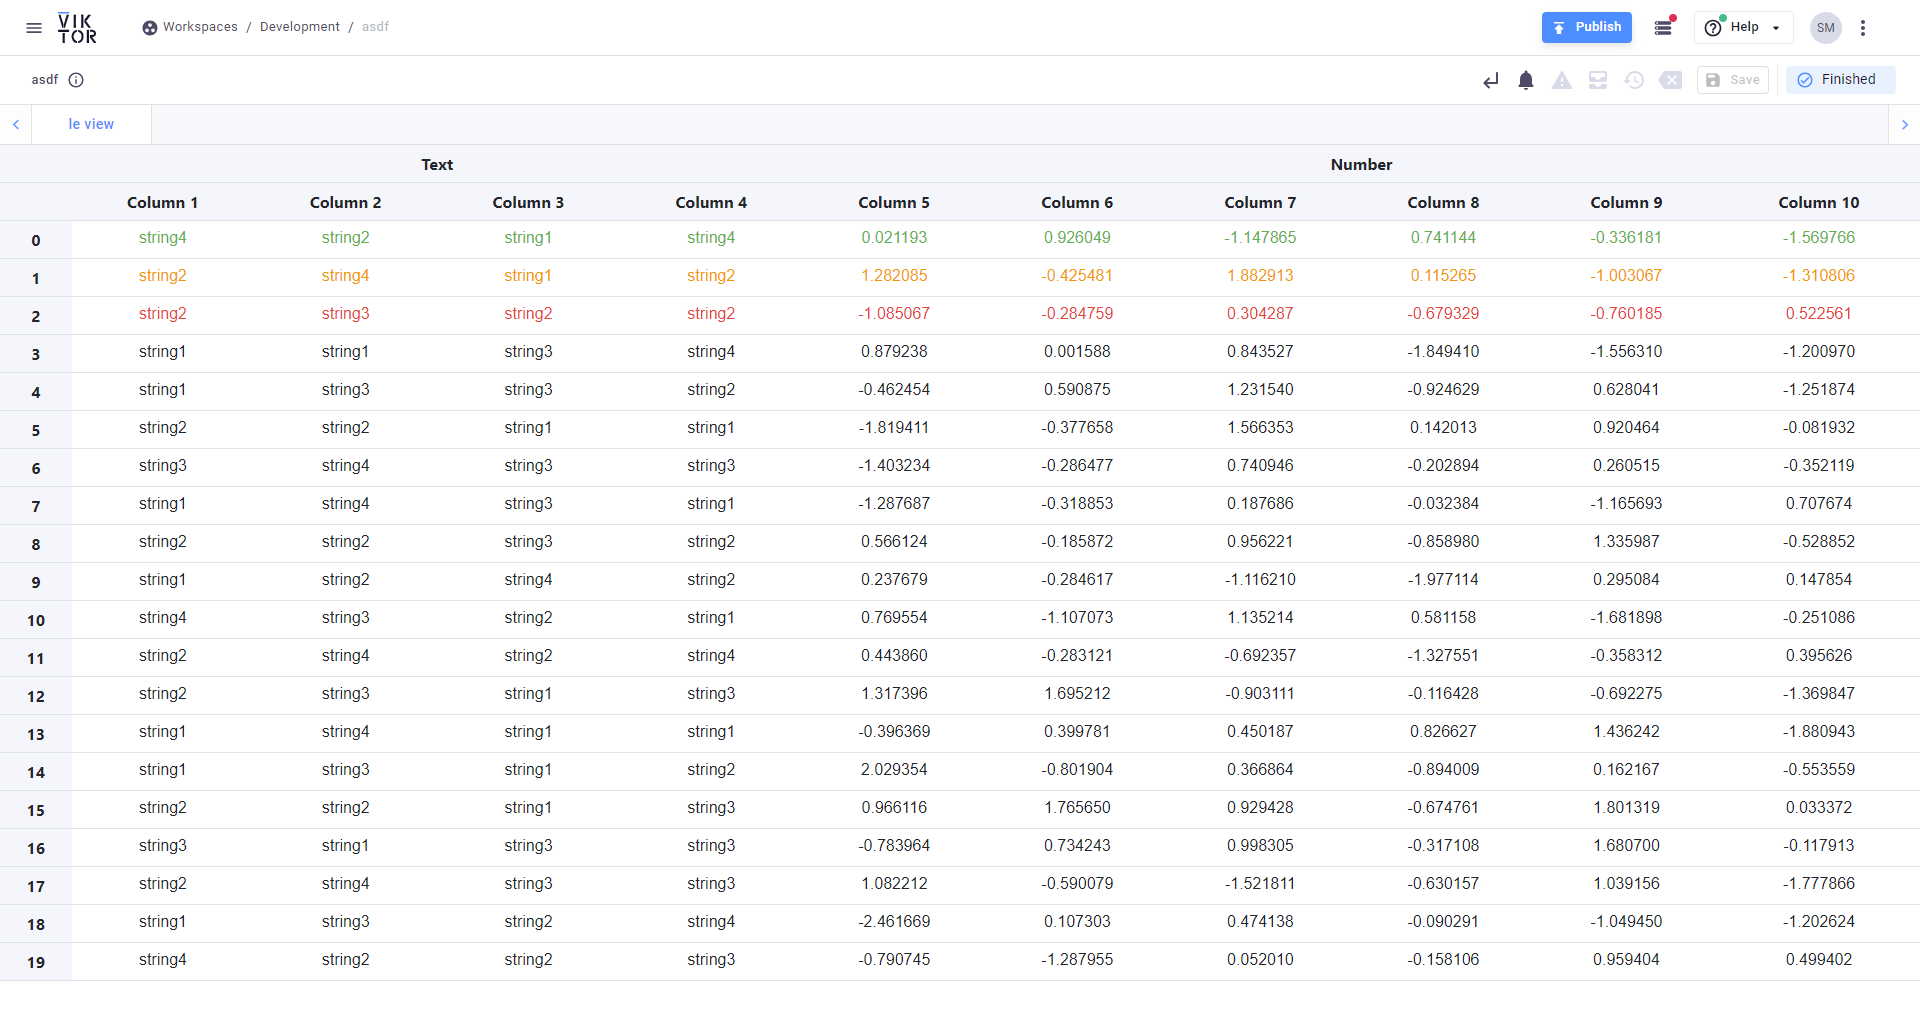
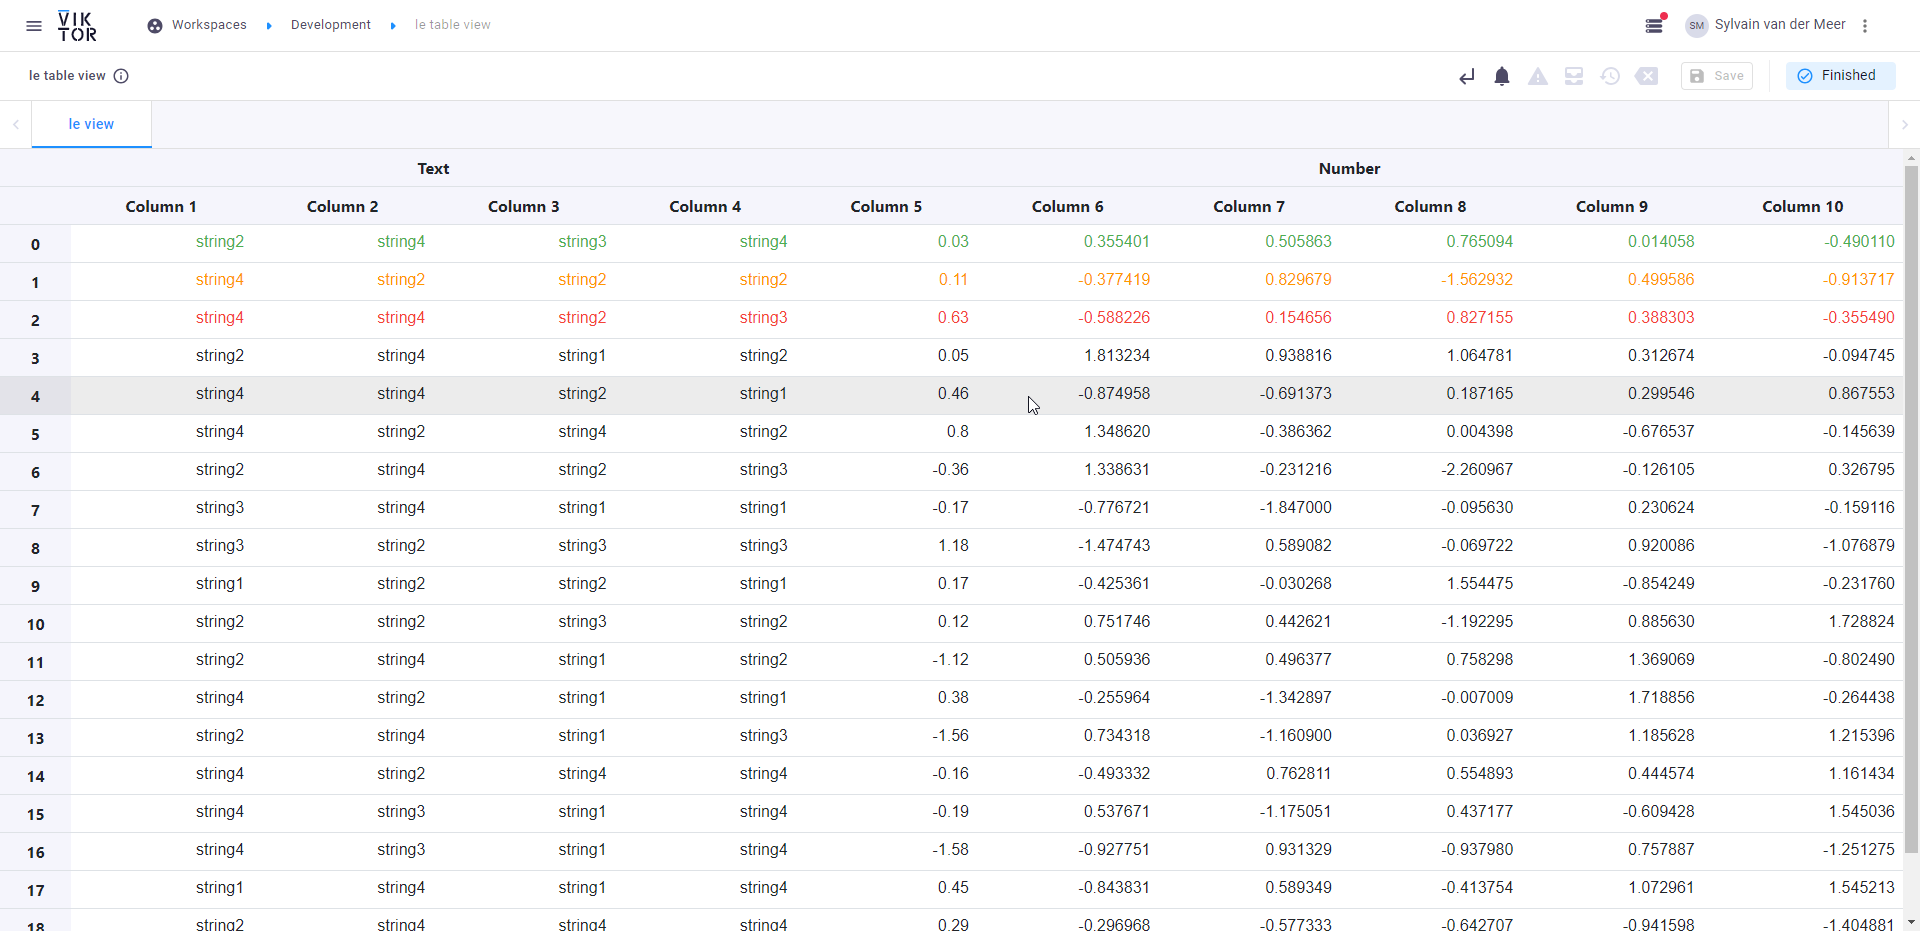
Results
And voilà! You have created a table view that was custom built:
Current alternatives, and things to note…
I think this post would not be complete without mentioning the alternatives, and adding the things that one needs to consider.
Currently it is also possible to use packages such as bokeh and plotly to construct a table with a WebView or PlotlyView. There are some limitations, however, such as:
- the syntax could be quite verbose if you simply want to convert a
pandasDataFrameto html. - these packages can’t display multi-index columns or multi-index indices.
These points were addressed with this package, as well as:
- customization can be done by for example use the
n_decimalsargument to determine by how many decimals you want to round your values, or by using thedataframe_colorsargument to display the text in the colour of choice (e.g. “success”, “warning”, “error” or “info”). - advanced customization can also be passed on to the
TableResultclass by styling yourpandas.Stylerobject yourself, and pass that to thestylekeyword argument.
How this was built
The TableView was built “on top of” the WebView. The WebView is a view that allows for any html to be rendered as a view. Therefore, you could render your own html if you want to. For my case, I created an html template, which was then used as basis for rendering the html that was passed on.
If you are curious to know more, let me know in the comments, or check out the repository, where you can look into the code of this custom TableView. Contributions to the view are very welcome.
Finally, I hope this triggers you to think of a view that you are currently missing. You can use the source code of this package as a basis to make your own VIKTOR view package!