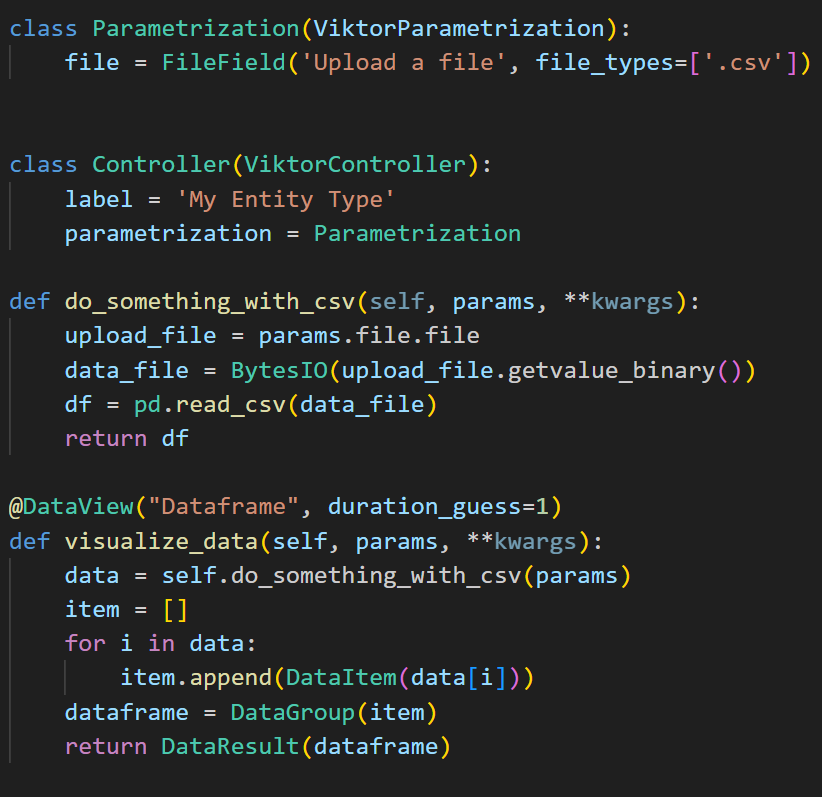
I made a FileField where people can upload a CSV file.
With this file I want to visualize a dataframe.
It is not working. What is the right way to call the CSV file and visualize its dataframe?
Hi Anne,
Welcome to the forum, thanks for posting!
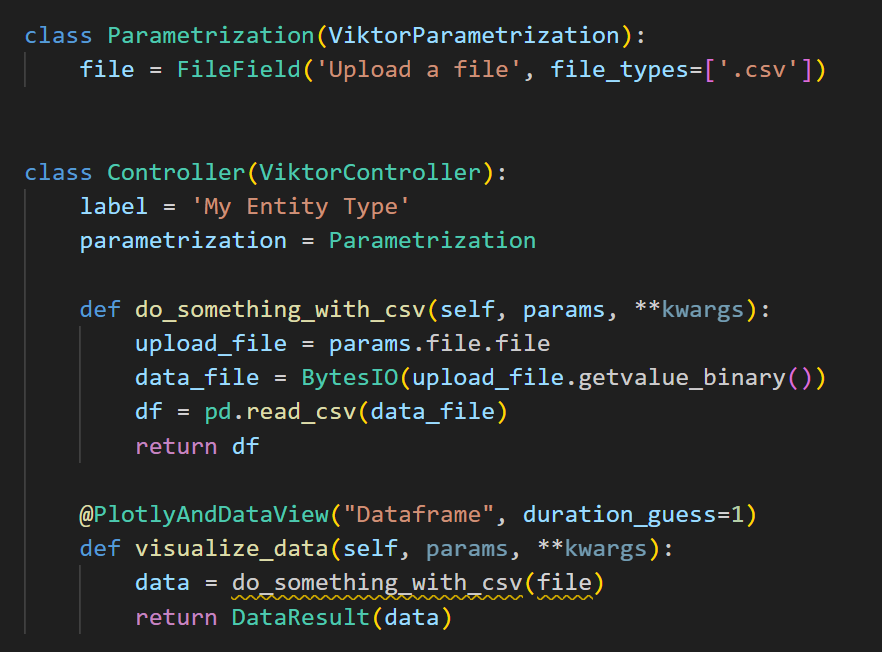
You’re quite far along already with your use-case but there’s still a couple of things that are going wrong. Firstly, you’re using a PlotlyAndDataView but not returning a PlotlyAndDataResult but I assume this is because you simplified the example for this post, so I will handle you use-case as if it were just a DataView.
Another issue is the way you call the do_something_with_csv method. You need to call it as a separate method from the Controller class. Moreover you are entering file as an argument to that method while it requires the params. So that would then become:
def do_something_with_csv(self, params, **kwargs):
    upload_file = params.file.file
    data_file = BytesIO(upload_file.getvalue_binary())
    df = pd.read_csv(data_file)
    return df

@DataView("Dataframe", duration_guess=1)
def visualize_data(self, params, **kwargs):
    data = self.do_something_with_csv(params)
Finally, and I think this is your main issue, the DataResult (or PlotlyAndDataResult for that matter) require a DataGroup object which in turn consists of DataItem objects. So you can’t simply pass your dataframe in there. So you have two choices:
DataItem objects. See the docs on DataItem to see how these are structured.Let me know if this information helps you out, or if you have any other questions!
Hi Anne,
As seen in the documentation the DataItem needs at minimum a label and a value. So depending on the contents of your csv you should adjust the input accordingly.
Hi @AnneHeijbroek, I stumbled across your topic and was wondering: would you by any chance be helped by using the TableView shown in this topic: Snippet Wednesday - My own TableView! 🌐 It takes a dataframe directly and visualises it as a table.
Just thought it might be relevant for you.
Thankyou, I think that is super helpful and relevant! I will try it out.
Thankyou, I will try it out!
Hi it worked, I can display a table of 5 or more rows.
It does give an error when I want to visualize too many rows (like 3000 rows)
Can I do anything to fix that?
And another question. I would like to visualize to tables in one ‘tab’.
Is this possible?