Dear VIKTOR team,
I am encountering an error while trying to export a plotly graph as a html file.
The error is as follows:
UnicodeEncodeError: 'charmap' codec can't encode character '\u25c4' in position 289925: character maps to <undefined>
The error is triggered by:
        fig = px.scatter(dataframe,
                                 x='CLAS_VOLUMEGEWICHT_NAT',
                                 y='MONSTER_NIVEAU',
                                 color='CLAS_GRONDSOORT',
                                 symbol=None)

        bytes_buffer = io.BytesIO()
        fig_bytes = fig_plotly.to_html(bytes_buffer)
        fig_file = File.from_data(fig_bytes)
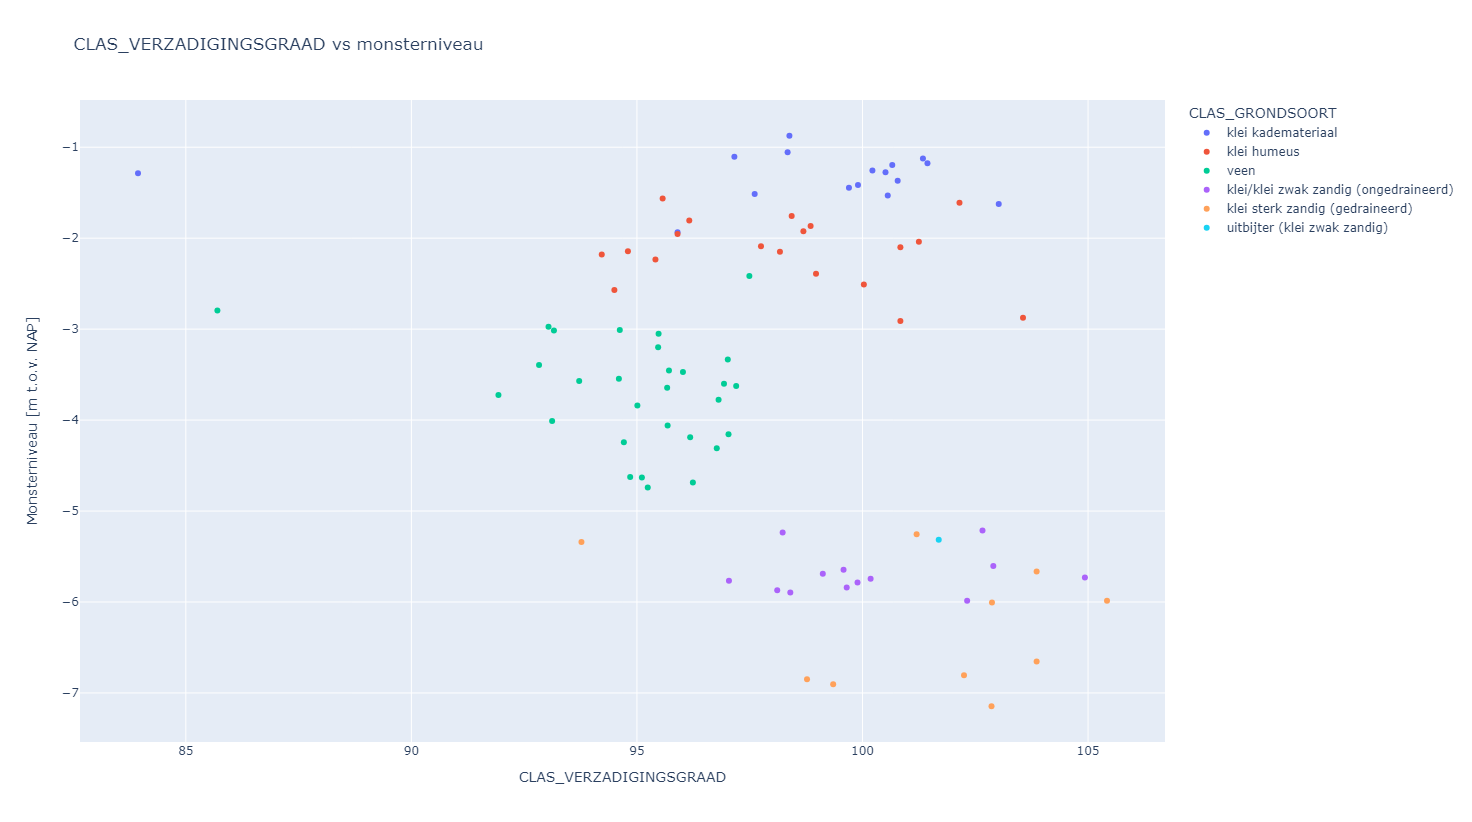
The graph I am trying to export is a px.scatter - graph:
I don’t understand this error, as character ‘\u25c4’ is this character ◄ I think and I didn’t use it (on purpose). Could you help me please?
Thanks in advance,
Yida
Hi Yida,
I think that your code does not require a BytesIO to get the HTML. Could you check if the following works?
        fig = px.scatter(dataframe,
                                 x='CLAS_VOLUMEGEWICHT_NAT',
                                 y='MONSTER_NIVEAU',
                                 color='CLAS_GRONDSOORT',
                                 symbol=None)

        html_string = fig.to_html()
        fig_file = File.from_data(html_string)
What version of plotly are you using? From this issue on the plotly Github it appears that this is resolved by upgarding to plotly 5.13 or higher.
Hi Marcel (@mslootweg) and Raoul (@rdejonge),
Thanks for your replies. I tried both without the BytesIO-line and increasing the plotly-version to 5.18, I was already using 5.17. Unfortunately, I keep encountering the same error.
I think it might have something to do with the encoding (utf-8 or cp1252) but I don’t understand it fully. Do you maybe have a suggestion on where to put the encoding bit in the code?
Hi Yida,
The plotly method to_html() outputs a string which you can encode to bytes. From the Github issue it appears that you need to explicitly encode as utf-8 on Windows (since it uses a different default encoding). You can do this as follows:
fig = px.scatter(dataframe,
                         x='CLAS_VOLUMEGEWICHT_NAT',
                         y='MONSTER_NIVEAU',
                         color='CLAS_GRONDSOORT',
                         symbol=None)

html_string = fig.to_html()
fig_file = File.from_data(html_string.encode('utf-8'))
1 Like
Thanks for the code snippet, Raoul, it works! I also got another suggestion from a colleague that works.
So, to summarize, the two possibilities to solve this Plotly UnicodeEncodeError are:
- Explicitely encode as utf-8 on Windows:
fig = px.scatter(df, x=x, y=y)
html_string = fig.to_html()
fig_file = File.from_data(html_string.encode('utf-8'))
- Write HTML using include_plotlyjs=‘cdn’:
fig = px.scatter(df, x=x, y=y)
html_string = fig.to_html(include_plotlyjs='cdn')
fig_file = File.from_data(html_string)
By the way, the output file from #1 is 1 MB, whereas the output file from #2 is 3 kB.
2 Likes
These 2 options can be used together (so no need to choose between the 2).
In the second option, the shared JS library of Plotly is included in the HTML, where in the first options, this JS library is only included as a link to a location on the internet.
So when you are using the html result on a location where you have internet (like a VIKTOR app). Always better to include include_plotlyjs='cdn'
Concerning encodings, i would always try to keep that in to your own control, since default encodings can diver between platforms (Windows/linux). So explicit specifing them where possible is always a good idea.
I would use the following:
fig = px.scatter(df, x=x, y=y)

fig_file = File()  # empty VIKTOR File
with fig_file.open(encoding='utf-8') as fp:  # open file in text mode qith encoding utf-8
    fp.write(fig.to_html(include_plotlyjs='cdn'))  # write html string into the file
2 Likes