Description of the limitation and why it is relevant to address
As a developer I want to that a GeoPolygon object supports multipolygons so that more complex shapes can be visualized in a mapview
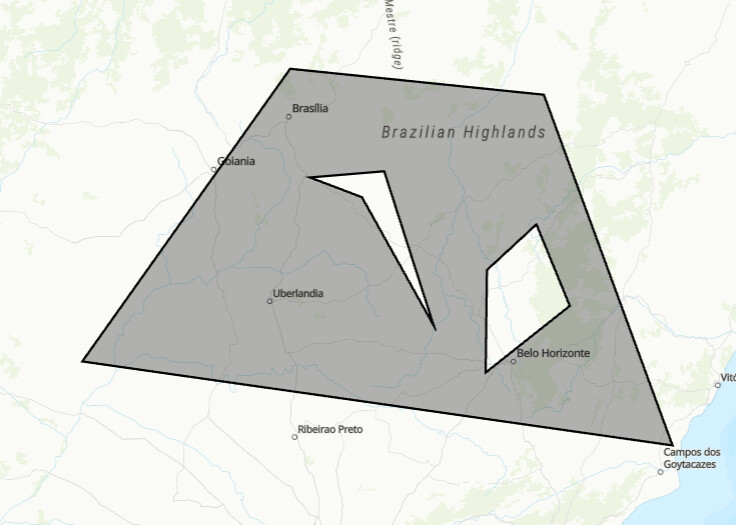
I think this is relevant for the VIKTOR platform because multipolygons are a common feature. For example, a hole in a polygons results in a polygon (an exterior polygon with an interior polygon). See example below with a grey polygon with a hole in it.
Submitter proposed design (optional)
None
Current workarounds
None
Hi Vincent,
Thank you for writing up this feature request. Could you maybe elaborate a bit more on why you are experiencing the lack of multi polygon support as a limitation? What are you trying to achieve, but cannot do without this functionality? This way we can understand the use case better.
Kind regards,
Raoul
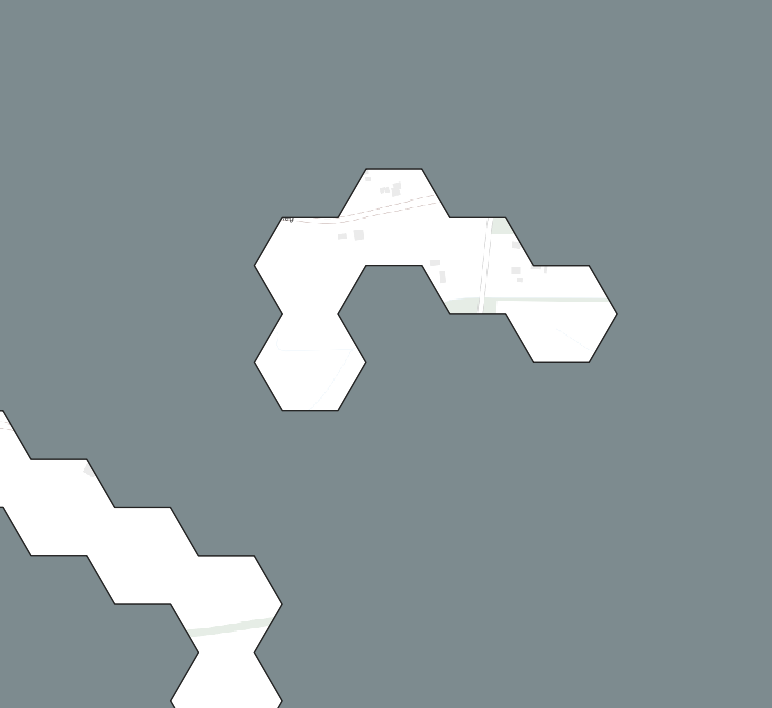
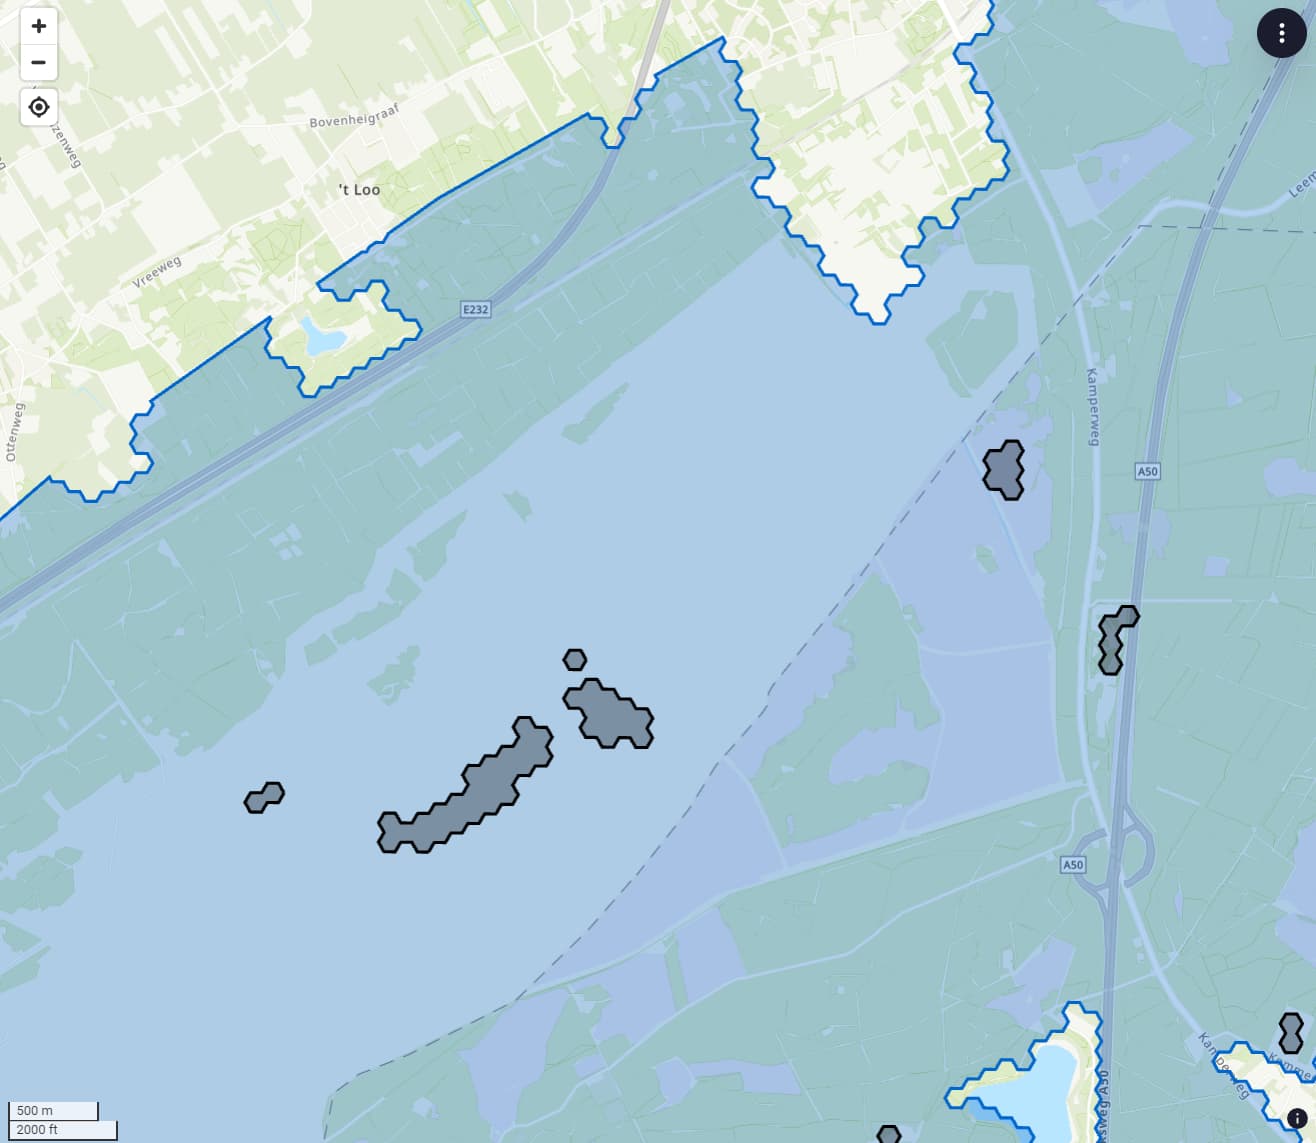
Hey, sure. Take a look at the screenshot below. The blue polygon is the exterior of a polygon. The black polygons are supposed to be holes in the polygon.
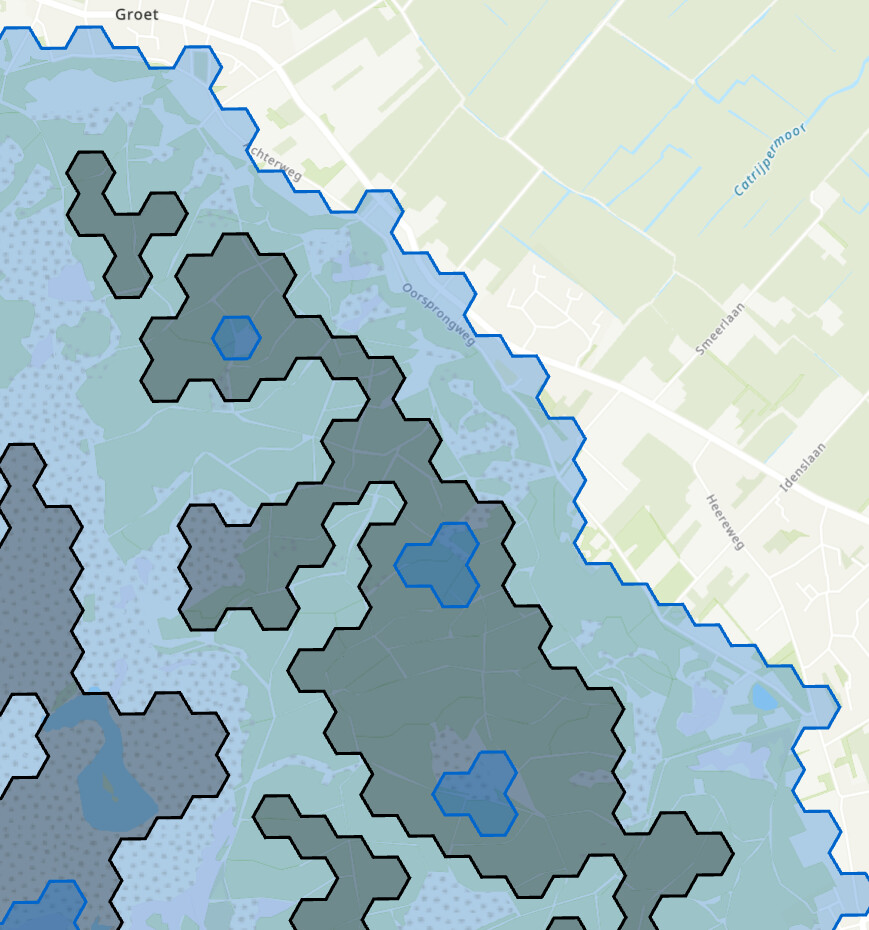
In the second image, I have a true multipolygon. You have 1 blue exterior polygon. In that, there are several holes (black). Some of these holes contain another polygon (blue).
The viktor GeoPolygon object only supports the exterior of a polygon, and thus holes (and more feature in that hole) are not possible.
@Vincentvd we don’t have multipolygon support for the MapView i believe, but it is supported on the GeoJSONView
there are a whole lot of brackets to keep track of, but this seem to work
@GeoJSONView('GeoJSON View', 1)
    def get_geojson_view(self, params, **kwargs):

        geojson = {
        "type": "FeatureCollection",
        "features": [
            {
            "type": "Feature",
            "properties": {},
            "geometry": {
            "type": "MultiPolygon",
            "coordinates": [
            [
            [
                [
                -47.900390625,
                -14.944784875088372
                ],
                [
                -51.591796875,
                -19.91138351415555
                ],
                [
                -41.11083984375,
                -21.309846141087192
                ],
                [
                -43.39599609375,
                -15.390135715305204
                ],
                [
                -47.900390625,
                -14.944784875088372
                ]
            ],
            [
                [
                -46.6259765625,
                -17.14079039331664
                ],
                [
                -47.548828125,
                -16.804541076383455
                ],
                [
                -46.23046874999999,
                -16.699340234594537
                ],
                [
                -45.3515625,
                -19.31114335506464
                ],
                [
                -46.6259765625,
                -17.14079039331664
                ]
            ],
            [
                [
                -44.40673828125,
                -18.375379094031825
                ],
                [
                -44.4287109375,
                -20.097206227083888
                ],
                [
                -42.9345703125,
                -18.979025953255267
                ],
                [
                -43.52783203125,
                -17.602139123350838
                ],
                [
                -44.40673828125,
                -18.375379094031825
                ]
            ]
            ]
        ]
        }
            }
        ]
        }

        return GeoJSONResult(geojson)
I indeed saw that. But, you can’t draw on a GeoJsonView right? We use a MapView to both ask for input (GeoPolygonField) and visualize input.
You can also draw on the GeoJSONView. Actually the MapView is just a convenience layer on top of the GeoJSONView (easier objects).
As a side note: Could the drawing on GeoJSONView be appended to the documentation? It now only states MapView. See GeoPointField, GeoPolylineField, GeoPolygonField in the SDK and Map features.
.
1 Like