Visualize GIS-rasters in VIKTOR
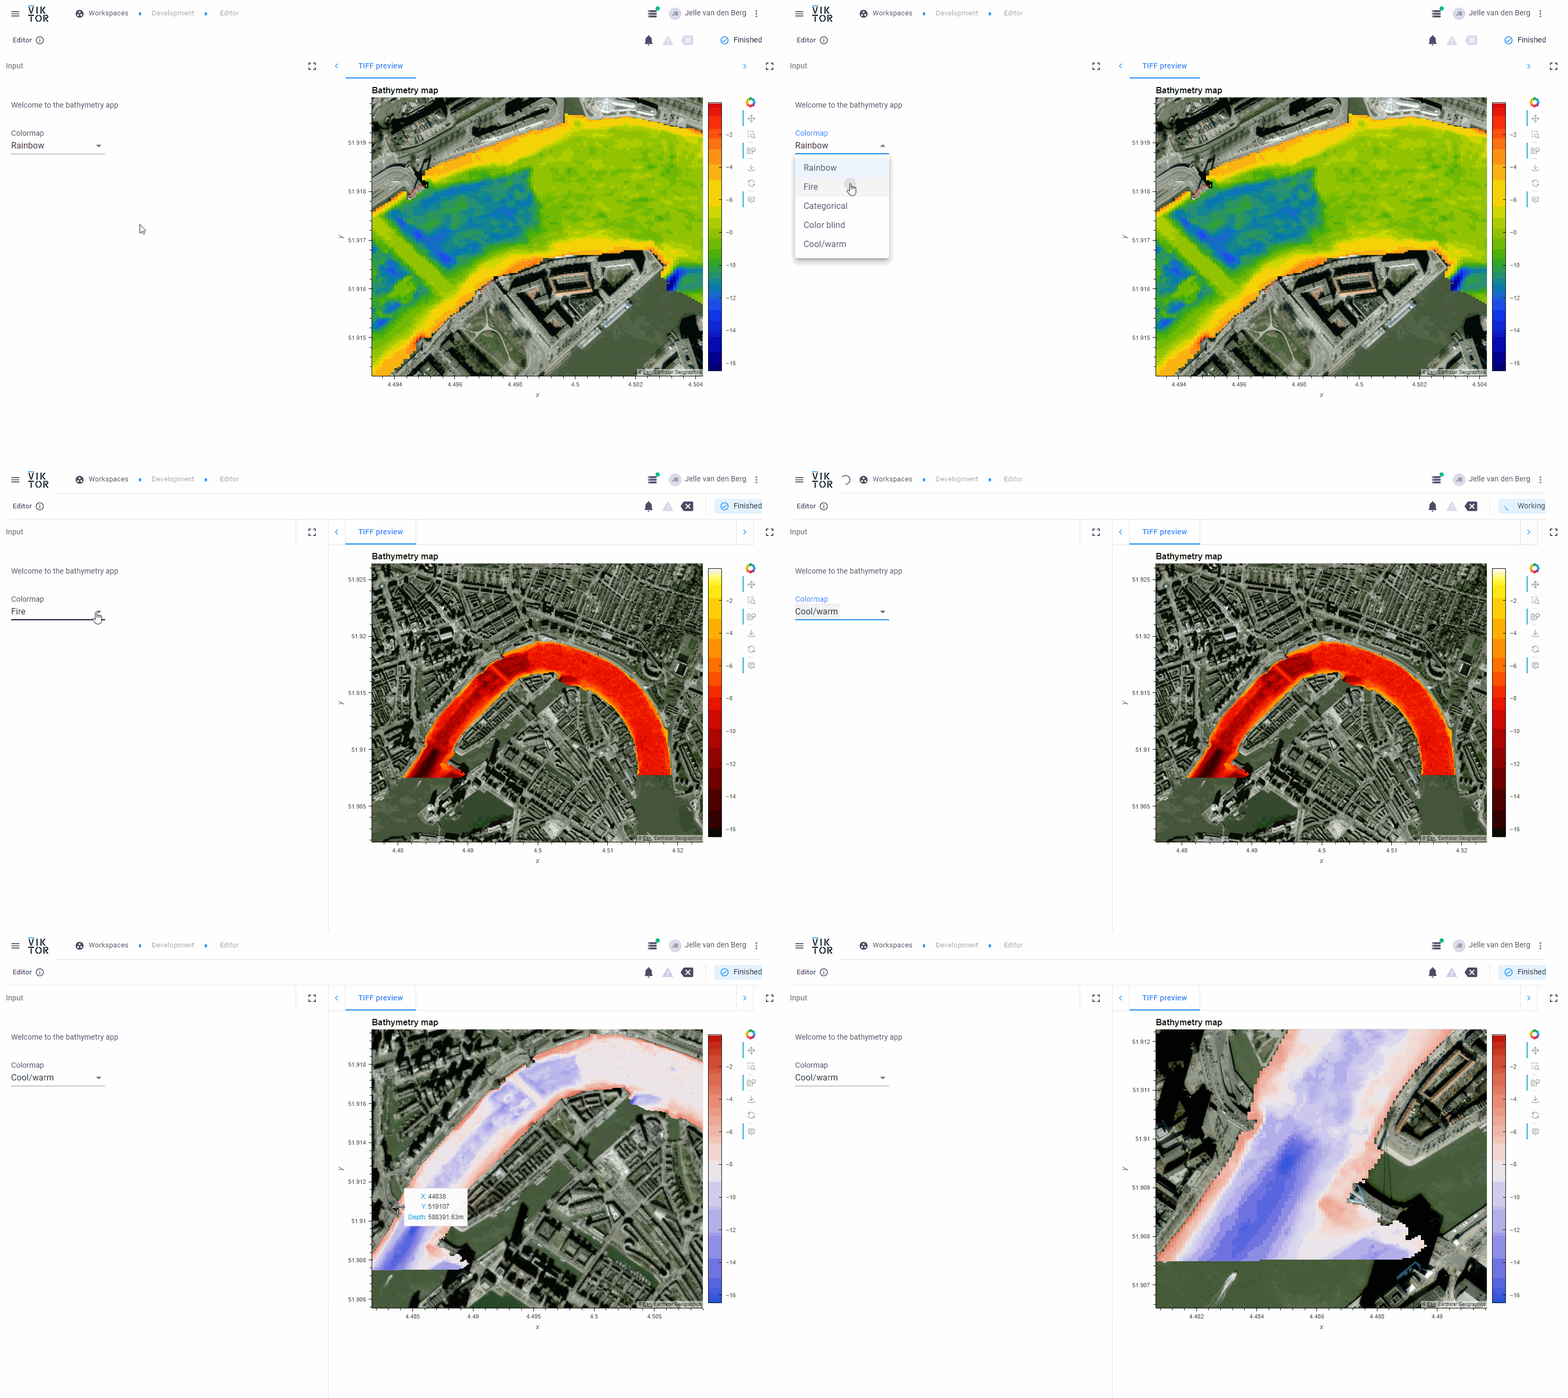
Another GIS-application for this snippet wednesdays: Visualize your raster data, such as .tiff files, in VIKTOR!
The visualization also includes a cool hover function, which shows the value of each raster cell, when the mouse is
hovering over it. This feature uses a few libraries which do all the heavy lifting. Credits go to
this datascience blogpost,
where most of the techniques are explained in great detail.
Let’s first start with our requirements:
viktor==14.6.0
holoviews==1.17.1
rioxarray==0.15.0
colorcet==3.0.1
datashader==0.15.2
Now, one of our sub-dependencies is Numba, which dramatically improves the speed of the rendering. We need to set an
environment where Numba can do its caching. Start your app.py file with the following lines:
os.environ["NUMBA_CACHE_DIR"] = str(Path(__file__).parent / "tmp" / "cach_temp")
import holoviews.operation.datashader as hd
Then, for the view itself:
    @WebView("TIFF preview", duration_guess=1)
    def tiff_preview(self, params, **kwargs):
        """WebView for displaying a map with a bathymetry. The map contains a hover functionality which will show the
        user the value on the indicated location.
        """
        dataarray = rxr.open_rasterio(Path(__file__).parent / "maas_rotterdam_bruggen_3857.tif")
        no_data_value = dataarray.attrs["_FillValue"]
        min_value = np.nanmin(dataarray.values[dataarray.values != no_data_value])
        max_value = np.nanmax(dataarray.values[dataarray.values != no_data_value])
        range_value = max_value - min_value
        min_value -= range_value / 100
        max_value += range_value / 100
        if params.colormap == "Rainbow":
            colormap = cc.rainbow4
        elif params.colormap == "Fire":
            colormap = cc.fire
        elif params.colormap == "Categorical":
            colormap = "Category20c"
        elif params.colormap == "Color blind":
            colormap = cc.CET_CBD1
        elif params.colormap == "Cool/warm":
            colormap = cc.coolwarm

        # Set no data value to transparent
        if no_data_value > max_value:
            colormap[-1] += "00"
        else:
            colormap[0] += "00"

        hv.extension("bokeh", logo=False)
        hv_dataset = hv.Dataset(dataarray[0], vdims="Depth", kdims=["x", "y"])
        formatter_code = """
          var digits = 4;
          var projections = Bokeh.require("core/util/projections");
          var x = special_vars.x; var y = special_vars.y;
          var coords = projections.wgs84_mercator.invert(x, y);
          return "" + (Math.round(coords[%d] * 10**digits))+ "";
        """

        formatter_code_x, formatter_code_y = formatter_code % 0, formatter_code % 1
        custom_tooltips = [("X", "@x{custom}"), ("Y", "@y{custom}"), ("Depth", "@image{0.00}m")]
        custom_formatters = {
            "@x": bokeh.models.CustomJSHover(code=formatter_code_x),
            "@y": bokeh.models.CustomJSHover(code=formatter_code_y),
        }
        custom_hover = bokeh.models.HoverTool(tooltips=custom_tooltips, formatters=custom_formatters)

        hv.opts.defaults(
            hv.opts.Image(
                cmap=colormap,
                height=600,
                width=800,
                colorbar=True,
                tools=[custom_hover],
                active_tools=["wheel_zoom"],
                clim=(min_value, max_value),
            ),
            hv.opts.Tiles(active_tools=["wheel_zoom"]),
        )
        hv_tiles_osm = hv.element.tiles.EsriImagery()

        hv_image_basic = hd.Image(hv_dataset)

        dynmap = hd.regrid(hv_image_basic)
        hv_combined_basic = hv_tiles_osm * dynmap
        hv_combined_basic.opts(title="Bathymetry map")

        column = pn.Column(hv_combined_basic, align="center", sizing_mode="stretch_both")

        html_result = BytesIO()
        column.save(html_result, embed=True, max_opts=5)

        return WebResult(html=StringIO(html_result.getvalue().decode("utf-8")))
The app in action:

Please check out a published version of the app on our demo page!