The most common file format for working with GIS-files still is the .shp-file. It is really easy to use shapefiles in your VIKTOR app using the powerful geopandas library. For the first snippet we use the FileField to upload the zipped shapefile. Then, we put it into our snippet to convert it to a GeoDataFrame. The GeoDataFrame is a powerful format with which you can do all kinds of GIS-analysis.
shapefile_upload = FileField("Upload file", description="Upload GIS-data")


def VIKTOR_FileField_to_gdf(upload_file: FileResource) -> GeoDataFrame:
    """Converts a VIKTOR FileField to a Geopandas GeoDataFrame"""
    shapefile_file = upload_file.file
    data_IO = BytesIO(shapefile_file.getvalue_binary())
    gdf = gpd.read_file(data_IO)
    return gdf
For example, to visualize the GeoDataFrame, we can call its method “to_json”. Combined with the VIKTOR GeoJSONView we can easily visualize the shapefile
@GeoJSONView("Map view", duration_guess=1)
def get_geojson_view(self, params: Munch, **kwargs) -> GeoJSONResult:
    """Get the uploaded geodataframe, convert it to a GeoJSON and show result on map."""
    gdf = VIKTOR_FileField_to_gdf(params.shapefile_upload)
    geojson = json.loads(gdf.to_json())
    return GeoJSONResult(geojson)
The snippets put together in an app result in the image below.
By the way, you can also combine the MapView and input fields with the GeoJson as follows:
@GeoJSONView("Map view", duration_guess=1)
def get_geojson_view(self, params: Munch, **kwargs) -> GeoJSONResult:
    """Combine a geodataframe and input form params and show result on map."""
    # create a GeoJSON as described by Jelle
    geosjon = ...

    # use the "normal" VIKTOR Map things: MapPolylines, MapLegends ...
    features = []
    if params.input_geoline:
        features.append(MapPolyline.from_geo_polyline(params.input_geoline))
    legend = MapLegend([(Color.from_hex('#0016FF'), "I'm blue")]

    # add these to the geojson
    for geometry in MapResult(features).geojson["features"]:
        geojson["features"].append(geometry)

    return GeoJSONResult(geojson, legend=legend)
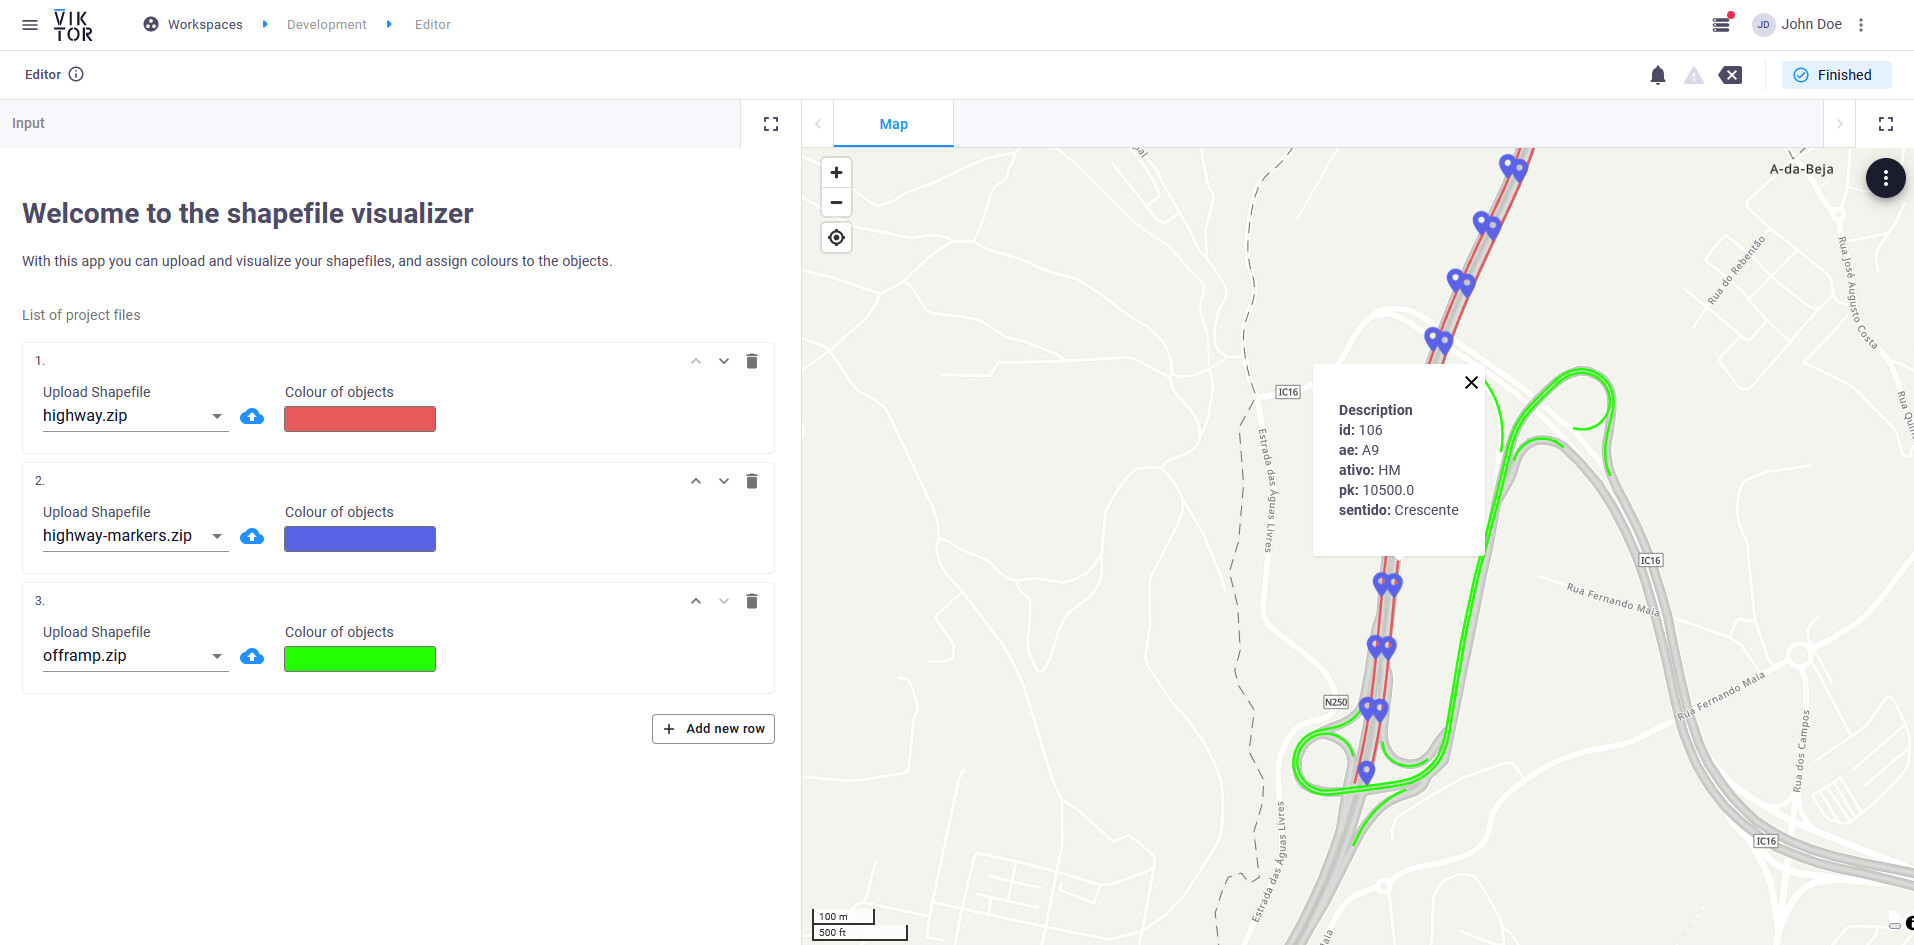
Great post(s)! I also have an old demo app lying around that fits well with the snippets you posted. In this demo app, I presented a way to upload a list of shapefiles, after which I could assign a colour to the shapefile object.
Here is the snippet:
import json
from io import BytesIO

import geopandas
from viktor import ViktorController, Color
from viktor.parametrization import ViktorParametrization, DynamicArray, FileField, ColorField, Text
from viktor.views import GeoJSONResult, GeoJSONView


class Parametrization(ViktorParametrization):
    text = Text("""# Welcome to the shapefile visualizer
With this app you can upload and visualize your shapefiles, and assign colours to the objects.
    """)
    dynamic_array = DynamicArray('List of project files')
    dynamic_array.shp_file = FileField('Upload Shapefile', file_types=['.zip'])
    dynamic_array.color = ColorField('Colour of objects', default=Color.viktor_blue())


class Controller(ViktorController):
    label = 'My Entity Type'
    parametrization = Parametrization

    @GeoJSONView('Map', duration_guess=1)
    def get_geojson_view(self, params, **kwargs):
        geojson = {
            "type": "FeatureCollection",
            "features": []
        }
        for row in params.dynamic_array:
            if not row.get('shp_file'):
                continue
            _gdf = geopandas.read_file(BytesIO(row.shp_file.file.getvalue_binary()))
            _gdf = _gdf.to_crs('EPSG:4326')
            _geojson = json.loads(_gdf.to_json())
            for feature in _geojson['features']:
                feature['properties']['description'] = '**Description**  \n' + '  \n'.join([f"**{k}:** {v}" for k, v in feature['properties'].items()])
                feature['properties']['marker-color'] = row.color.hex
                feature['properties']['stroke'] = row.color.hex
                feature['properties']['fill'] = row.color.hex
                feature['properties']['marker-size'] = 'small'
            geojson['features'].extend(_geojson['features'])
        return GeoJSONResult(geojson)