Introduction
After all the very interesting but also quite advanced snippets we’ve seen the past few weeks, let’s take it back to the basics. This snippet isn’t very involved, but chances are high you’ve run into a usecase for it. It has nothing specifically to do with VIKTOR, and is purely Python. It’s about an incredibly usefull part of the Python standard library called itertools. Diving into the Python standard library every now and then, and trying to find something you did not know about before can be very enlightening. It’s a vast library, and it can probably do more than you’re aware of!
itertools.cycle
Itertools is a collection of functions used for creating iterators, things you can loop over in an efficient way. For my snippet today, I’d like to look at cycle (which you can find here).
Sometimes you want to continue looping over a list forever, even when you’ve reached the end. One usecase for this is when you are plotting and want plots to be grouped by color, but you can’t be sure how many groups you will have up front. In such a case you can use itertools.cycle to create a loop that returns to the start when it reaches the end.
Code
You can create a never ending list of iterable items like this:
from itertools import cycle

never_ending_list = cycle(['a', 'b', 'c', 'd'])
To use the cycle in a loop, you can use next:
for i in range(100):
    current_value = next(never_ending_list)
    print(current_value)
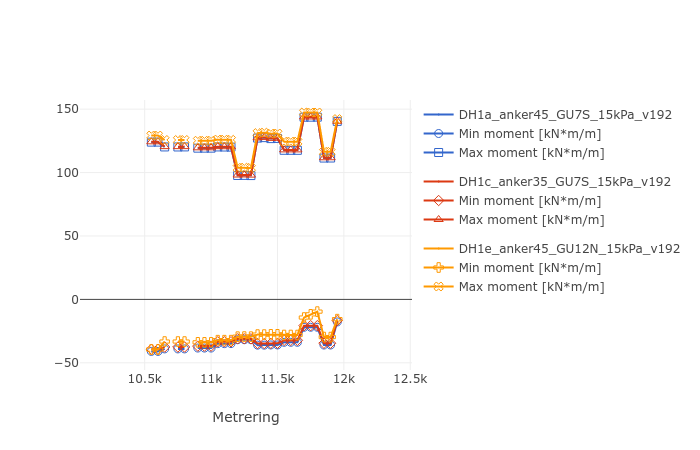
Let’s apply this to the usecase I mentioned, creating a plot where each group has a different color, without knowing up front how many groups there will be. You can end up with repeating colors here, but your loop will never fail regardless of how many items it has.
from itertools import cycle
import plotly as plt
import plotly.graph_objects as go


fig = go.Figure()

# First cycle is a color palette from
color_cycle = cycle(plt.colors.qualitative.G10)
marker_cycle = cycle(['circle-open', 'square-open', 'diamond-open', 'triangle-up-open', 'cross-open', 'x-open'])

# Result in this example is a Pandas dataframe, these have groupby functionality
for name, group in result_data.groupby('some column name'):
    if name in dsheetfiles_selected:
        # Select a color for this group, and add empty datapoint for starting the legendgroup
        groupcolor = next(color_cycle)
        fig.add_trace(go.Scatter(x=[None], y=[None], legendgroup=f'{name}', name=f'{name}',
                                 marker_color=groupcolor, marker_size=0))

        for param_name in params_to_visualise:
            y_values = [val if val != 0 else None for val in group[param_name]]
            fig.add_trace(go.Scatter(
                x=result_data['x-coordinate'], y=y_values,
                legendgroup=f'{name}',
                mode='lines+markers', name=f'{param_name.strip()}',
                marker_color=groupcolor, marker_symbol=next(marker_cycle), marker_size=8
            ))

fig.update_layout(xaxis_title='Metrering', showlegend=True, template='none')