Snippet Wednesday - ⏱️ Time profiling the parametrization ⏱️

Many VIKTOR developers have encountered issues with slow parametrization, which is deemed problematic when the parameterization call exceeds a duration of 1 second. Sluggish parametrization significantly impacts the application, resulting in a laggy and unresponsive user experience, hampering its overall performance and responsiveness.

As the application grows in complexity with a multitude of parameters and intricate callbacks, pinpointing the specific areas where time is consumed becomes increasingly challenging. The expanding scope and complexity might obscure the source of the time penalty within the codebase, making it difficult to identify the exact segments responsible for the slowdown in execution.

Here profiling can help you out.

Time profiling

Time profiling in programming refers to the practice of measuring and analyzing the execution time of specific sections or the entirety of a program’s code. This technique helps developers identify performance bottlenecks by pinpointing which parts of the code take the most time to run. By utilizing specialized tools or modules, such as timeit or cProfile in Python, time profiling allows for precise measurement of execution times, aiding in the optimization and improvement of code efficiency for better overall performance.

Profiling wrapper

The following decorator can be used to profile a certain function as follows:

@profile_it()
def some_function(input_1, input_2)
    ...
import cProfile
from functools import wraps


def profile_it(output_file: str= None):
    """A time profiler decorator.
    Inspired by and modified the profile decorator of Giampaolo Rodola:
    http://code.activestate.com/recipes/577817-profile-decorator/
    Args:
        output_file: str or None. Default is None
            Path of the output file. If only name of the file is given, it's
            saved in the current directory.
            If it's None, the name of the decorated function is used.
    Returns:
        Profile of the decorated function
    """

    def inner(func):
        @wraps(func)
        def wrapper(*args, **kwargs):
            _output_file = output_file or func.__name__ + ".prof"
            pr = cProfile.Profile()
            pr.enable()
            retval = func(*args, **kwargs)
            pr.disable()
            pr.dump_stats(_output_file)
            return retval

        return wrapper

    return inner

Profiling the parametrization

Now the big question is, how do we profile the parametrization. This is done by overwriting the protected method _generate() on the parametrization object.

DISCLAIMER: YOU SHOULD NEVER OVERWRITE A PROTECTED MEMBER IN PRODUCTION CODE, ONLY USE IN DEVELOPMENT AND REMOVE THIS BEFORE PUBLISHING.

class Parametrization(ViktorParametrization):

    @profile_it()
    def _generate(self, *args, **kwargs):
        return super()._generate(*args, **kwargs)

    ... (field definitions)

Interpreting the profiling result

The decorator will save a .prof file on you local file system. This file can be interpreted using a tool like SnakeViz or the pstats module.

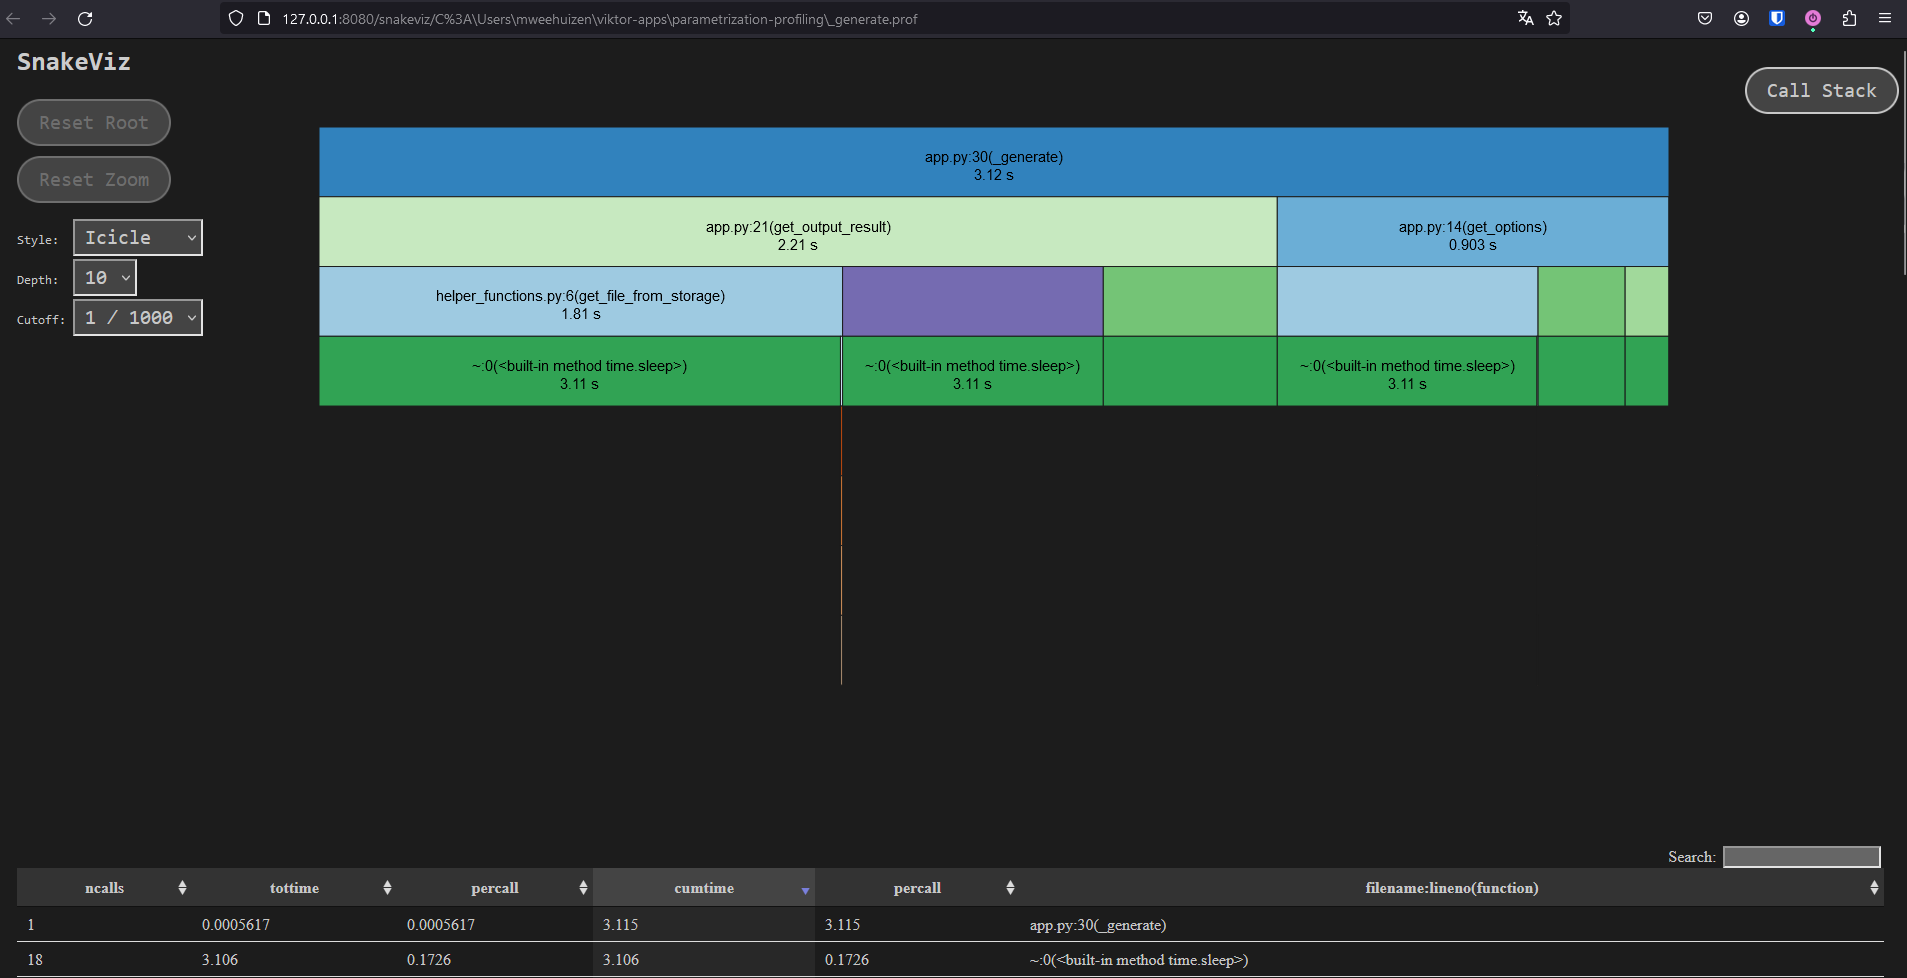
Using SnakeViz, it can be seen that, in the above example, 2 callbacks are responsible for the slow parametrization. Both these callback rely on the slow get_file_from_storage function, which is called 6 times!

Usual causes of slow parametrization

Often when an app is suffering from slow parametrization, some callback rely on a slow underleying function. This function can appear not that slow (+/- 300ms), but when multiple callbacks rely on this function or the callback is used in multiple fields, this can add up to multiple seconds of lag.

Profiling creates a great insight where to start optimizing your Parametrization.

9 Likes

Nice work @mweehuizen ! For those interested in an introduction to profiling, you can refer to this snippet by @kvangiessen :

1 Like

Very useful. Thanks!

@mweehuizen Very useful, thank you for sharing this approach with us. I’m yet to put it to the test and see the results!

If I understood correctly, it is fair to assume objects from the viktor.ai library will perform faster than callbacks in most cases?

I’m thinking for example to how we can pass an object e.g. parametrization.And(...) or a function func() to the attribute visible of a Field.

Does anybody know how to profile in a published Viktor app? My approach is to profile it and via a download button down the files. Locally, this works, in a published app not. The problem is that the profile tool has no permission to write the .prof file. I tried storing the .prof file in a temporary file (tempfile.TemporaryDirectory()) but as soon as the profiling is done, the temp file is also removed.

Any tips?

If you do not mind setting up a temporary view in a production application, you could consider writing the .prof file to Storage, which could then be presented in a WebView.

Curious to hear of other approaches, though…

I found a solution using storage indeed. I save a base64 encoding of the .prof file in storage. Using a dictionary I am able to profile multiple functions at the same time. I later download the files.

This my adapted profiler code:
Note that StorageService is a simple custom class around the viktor storage for some error handling.

import cProfile
import os
import base64
import tempfile
from functools import wraps

def profile_it(output_file: str | None = None):
    """A time profiler decorator.
    Inspired by and modified the profile decorator of Giampaolo Rodola:
    http://code.activestate.com/recipes/577817-profile-decorator/
    Args:
        output_file: str or None. Default is None
            Path of the output file. If only name of the file is given, it's
            saved in the current directory.
            If it's None, the name of the decorated function is used.
    Returns:
        Profile of the decorated function
    """

    def inner(func):
        @wraps(func)
        def wrapper(*args, **kwargs):
            home_dir = tempfile.mkdtemp()
            _output_file = output_file or os.path.join(home_dir, func.__name__ + ".prof")

            if os.path.exists(_output_file):
                os.remove(_output_file)

            pr = cProfile.Profile(builtins=False)
            pr.enable()
            retval = func(*args, **kwargs)
            pr.disable()
            pr.dump_stats(_output_file)

            with open(_output_file, "rb") as file:
                read_bytes = file.read()

            storage = StorageService()
            stored_profiler_data = storage.get_storage("profiler_files")
            if not stored_profiler_data:
                stored_profiler_data = {}

            input_file_string = base64.b64encode(read_bytes).decode()

            stored_profiler_data[func.__name__] = input_file_string

            storage.set_storage("profiler_files", stored_profiler_data)
            return retval

        return wrapper

    return inner

Create a Download button and add the following function in your controller:

from viktor.result import DownloadResult
from io import BytesIO
from viktor.errors import UserError

class controller:
  def download_profiler_files(self, params, **kwargs) -> DownloadResult:
          storage_data = StorageService().get_storage("profiler_files")
          entity_name = kwargs["entity_name"]
          zip_file = {}
          for file_name, file_data in storage_data.items():
              zip_file[f"{file_name}.prof"] = BytesIO(base64.b64decode(file_data))
  
          if zip_file:
              return DownloadResult(
                  zipped_files=zip_file,
                  file_name=f"tegsis_exports_{entity_name}.zip",
              )
          else:
              raise UserError("No profile found")
2 Likes