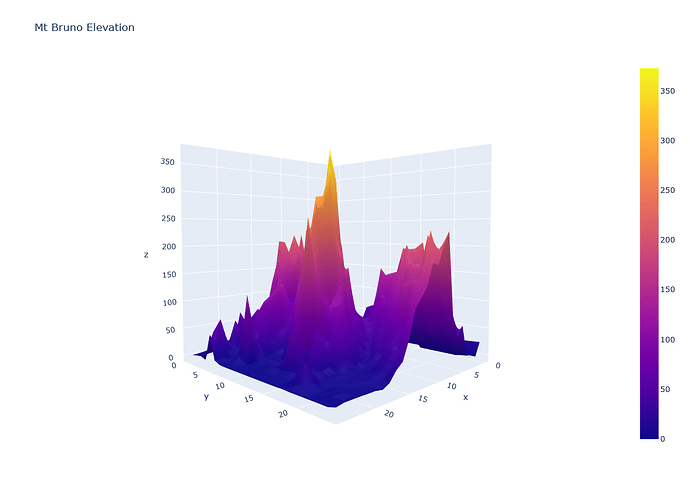
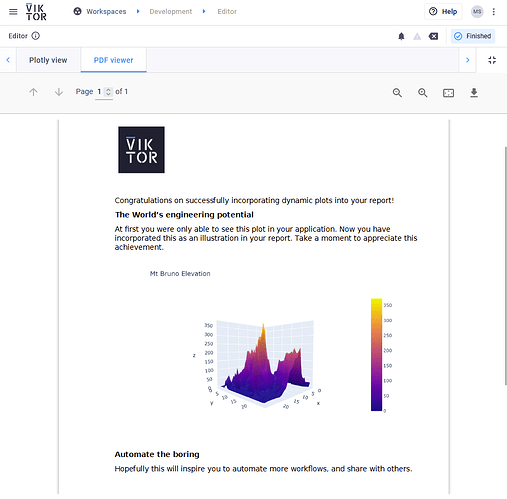
For this week, I’ve decided to dedicate a snippet on a development that I am seeing recurring in many projects. Many developers are creating user-friendly plots and graphs using the graphing libary plotly. But when it comes to the point where they have to include the figure in a report that needs to be downloaded, they get stuck. So, to help all future developers, herewith a step-by-step guide to do this.
The Snippet
This snippet will go through the following steps:
- Create a Plotly figure and PlotlyView
- Converting this figure to a static image (PNG)
- Adding this to a Word report
- Displaying as a PDFView
1. Plotly figure and PlotlyView
First of, let us take an example of a plotly figure that is rendered as a view:
👇Click here to see the code 👇
class Controller(ViktorController):
    label = '...'
    parametrization = Parametrization

    def get_plotly_figure(self):
        """Create 3D surface plot.

        Source: https://plotly.com/python/3d-surface-plots/
        """
        # Read data from a csv
        z_data = pd.read_csv('https://raw.githubusercontent.com/plotly/datasets/master/api_docs/mt_bruno_elevation.csv')

        fig = go.Figure(data=[go.Surface(z=z_data.values)])
        camera = dict(
            eye=dict(x=1.5, y=1.5, z=0.1)
        )

        fig.update_layout(title='Mt Bruno Elevation', scene_camera=camera)
        return fig

    @PlotlyView("Plotly view", duration_guess=1)
    def get_plotly_view(self, params, **kwargs):
        fig = self.get_plotly_figure()
        return PlotlyResult(fig.to_json())
2. Convert figure to a static image
To convert your plotly figure to a static PNG image, the following steps should be performed:
2.1. Add kaleido to your requirements.
![]() THE FOLLOWING IS VERY IMPORTANT
THE FOLLOWING IS VERY IMPORTANT ![]()
There seems to be an issue with kaleido that, when using the wrong version, it hangs during the process of converting the image. What makes it more annoying is that the version differs per operating system. Therefore, take note of the following:
When developing on Windows using venv, the conversion only works with versions kaleido==0.1.*. Therefore, only during development, install kaleido==0.1.0.post1.
For Linux developers and publishing, use kaleido==0.2.1.
Or to make life easier for all (this is a tip I got from my colleague @regbers ), simply add the following the requirements.txt file:
kaleido==0.2.1; platform_system == "Linux"
kaleido==0.1.0.post1; platform_system == "Windows"
2.2. Use the following code to convert your image
fig = self.get_plotly_figure()
# https://plotly.com/python/static-image-export/
img_bytes = BytesIO(fig.to_image(format="png", scale=2))
3. Add image to Word document
Adding an image to your Word template is quite straightforward once you’ve done the tutorial on Automatic Reporting, so I would recommend taking a look at that if you have not yet. Here is the snippet of the method that generates a report with the image:
    def generate_word_document(self, params):
        # Create emtpy components list to be filled later
        components = []

        # Fill components list with data
        fig = self.get_plotly_figure()
        # https://plotly.com/python/static-image-export/
        img_bytes = BytesIO(fig.to_image(format="png", scale=2))
        word_file_image = WordFileImage(img_bytes, 'img_tag', width=400)
        components.append(word_file_image)

        # Get path to template and render word file
        template_path = Path(__file__).parent / "report_template.docx"
        with open(template_path, 'rb') as template:
            word_file = render_word_file(template, components)

        return word_file
4. Display as PDF
To round it off, you could download it as a Word document using a DownloadButton, or view as a PDF. I like to view it within the app, so I chose for the latter:
All code
👇Click here to see the code 👇
requirements.txt
viktor
pandas
kaleido==0.2.1; platform_system == "Linux"
kaleido==0.1.0.post1; platform_system == "Windows"
app.py
from io import BytesIO
from pathlib import Path

import pandas as pd
import plotly.graph_objects as go

from viktor import ViktorController
from viktor.external.word import WordFileImage, render_word_file
from viktor.utils import convert_word_to_pdf
from viktor.views import PlotlyView, PlotlyResult, PDFView, PDFResult
from viktor.parametrization import ViktorParametrization


class Parametrization(ViktorParametrization):
    pass


class Controller(ViktorController):
    label = '...'
    parametrization = Parametrization

    def get_plotly_figure(self):
        """Create 3D surface plot.

        Source: https://plotly.com/python/3d-surface-plots/
        """
        # Read data from a csv
        z_data = pd.read_csv('https://raw.githubusercontent.com/plotly/datasets/master/api_docs/mt_bruno_elevation.csv')

        fig = go.Figure(data=[go.Surface(z=z_data.values)])
        camera = dict(
            eye=dict(x=1.5, y=1.5, z=0.1)
        )

        fig.update_layout(title='Mt Bruno Elevation', scene_camera=camera)
        return fig

    @PlotlyView("Plotly view", duration_guess=1)
    def get_plotly_view(self, params, **kwargs):
        fig = self.get_plotly_figure()
        return PlotlyResult(fig.to_json())

    def generate_word_document(self, params):
        # Create emtpy components list to be filled later
        components = []

        # Fill components list with data
        fig = self.get_plotly_figure()
        # https://plotly.com/python/static-image-export/
        img_bytes = BytesIO(fig.to_image(format="png", scale=2))
        word_file_image = WordFileImage(img_bytes, 'img_tag', width=400)
        components.append(word_file_image)

        # Get path to template and render word file
        template_path = Path(__file__).parent / "report_template.docx"
        with open(template_path, 'rb') as template:
            word_file = render_word_file(template, components)

        return word_file

    @PDFView("PDF viewer", duration_guess=5)
    def pdf_view(self, params, **kwargs):
        word_file = self.generate_word_document(params)

        with word_file.open_binary() as f1:
            pdf_file = convert_word_to_pdf(f1)

        return PDFResult(file=pdf_file)
Wrap up
I hope this helps all developers that are struggling with this. For anyone that finds that they can add to this topic, or has other suggestions/alternatives, it would be great to hear your input.

