Hi!
Recently we’ve released a new way to use the webview: it is now possible to send information from the webview back into the parametrization. Combined with some Javascript, which you can run in the webview, this is a really generic, powerful and interesting feature! In this post I’d like to demonstrate just one example of what you can build with this, but really, there is a lot possible with this feature! .
The Goal
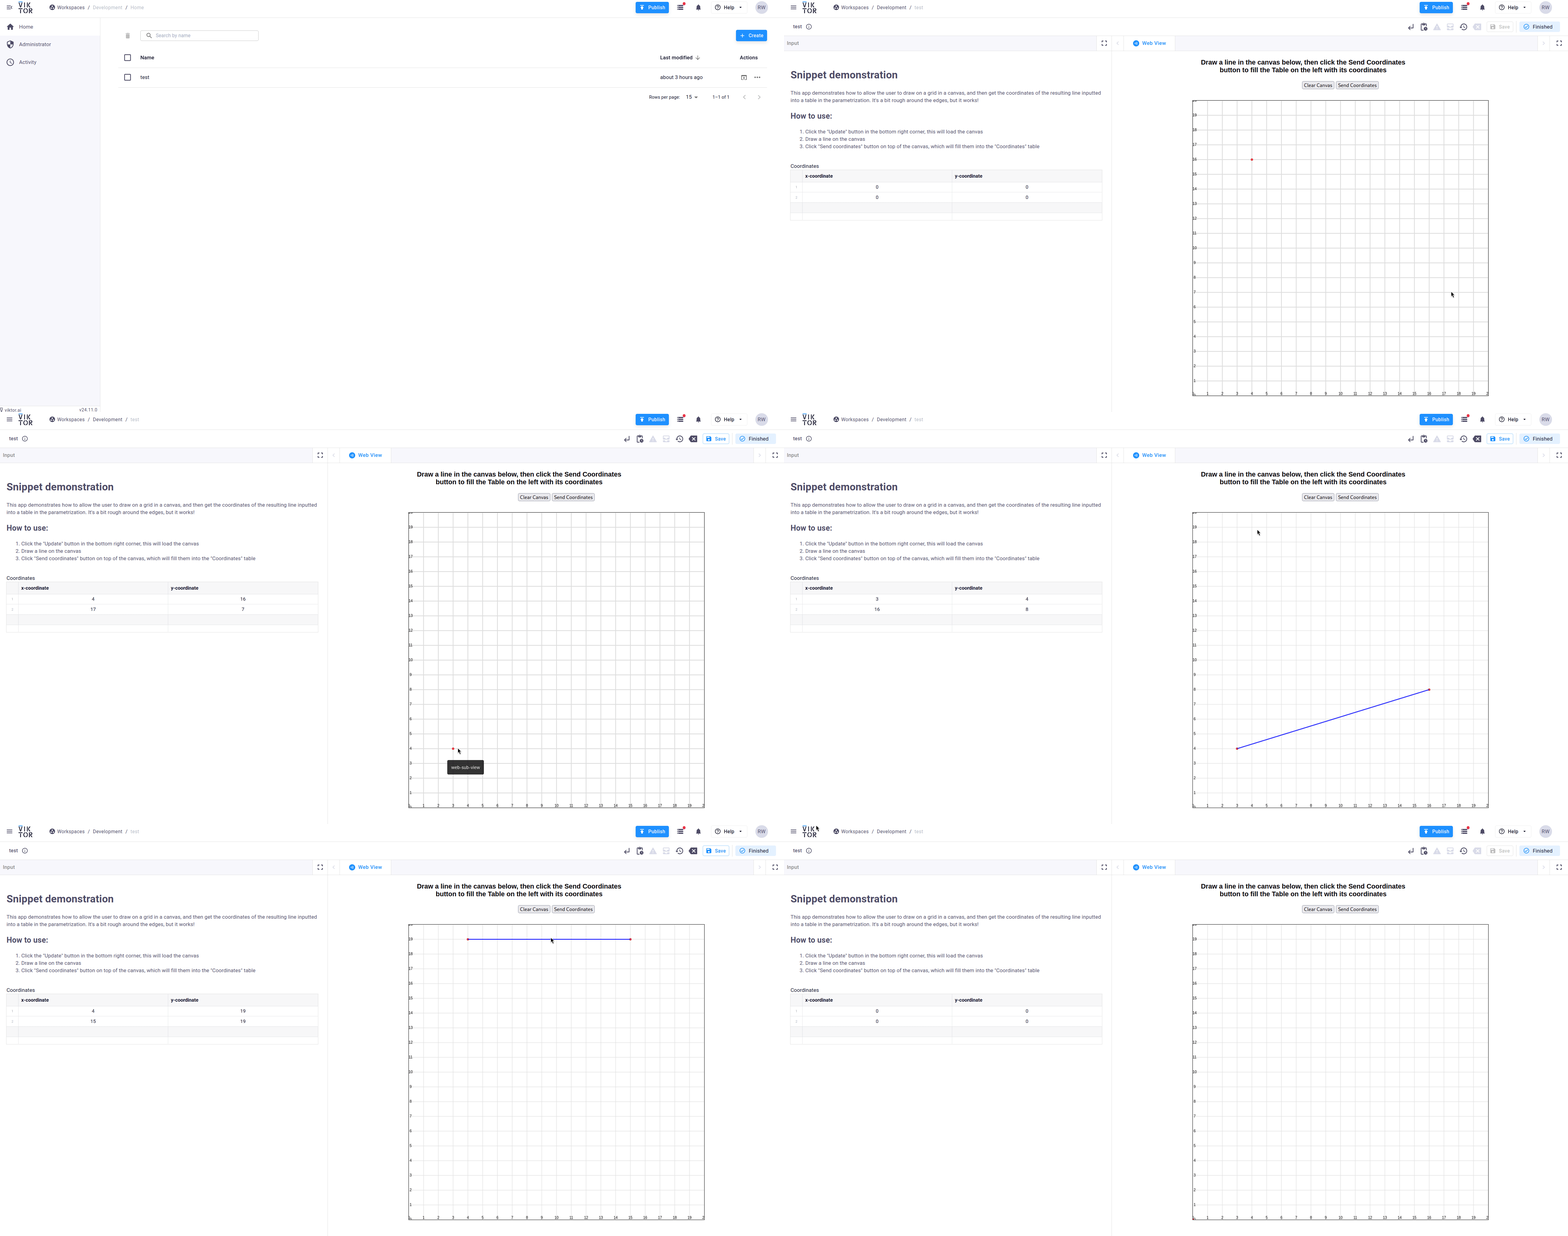
I thought I’d set up a small sample app to demonstrate something I’ve heard from multiple developers in the past: allowing the user to draw in a canvas space!
The result

The solution
Using Javascript, we can draw a canvas in the webview and allow the user to interact with it, drawing for this example a line. Then we send the coordinates from the start and endpoint of the line back using the webview interaction.
Let’s start with the app’s parametrization, which is quite minimal: it only has a table that the coordinates from the line are to be inputted into. Also, we start with a default set of coordinates of (0, 0):
_default_coords = [
    {'x': 0, 'y': 0},
    {'x': 0, 'y': 0}
]


class Parametrization(vkt.Parametrization):
    welcome = vkt.Text("""
# Snippet demonstration
This app demonstrates how to allow the user to draw on a grid in a canvas, and then get the coordinates of the resulting line inputted into a table in the parametrization. It's a bit rough around the edges, but it works!

## How to use:
1. Click the "Update" button in the bottom right corner, this will load the canvas
2. Draw a line on the canvas
3. Click "Send coordinates" button on top of the canvas, which will fill them into the "Coordinates" table
""")
    coordinatestable = vkt.Table("Coordinates", default=_default_coords)
    coordinatestable.x = vkt.NumberField("x-coordinate")
    coordinatestable.y = vkt.NumberField("y-coordinate")
Next, we set up the controller, which is again quite minimal. The only things we do are to create a webview, and import the points from the table into it. Then we use the automatically available environment variable VIKTOR_JS_SDK_PATH to set the correct value of the javascript sdk in our html page. The resulting controller looks like:
class Controller(vkt.Controller):
    parametrization = Parametrization

    @vkt.WebView("Web View")
    def get_web_view(self, params, **kwargs):
        html = (Path(__file__).parent / "example.html").read_text()
        html = html.replace("INITIAL_COORDINATES", json.dumps(params.coordinatestable))
        html = html.replace("VIKTOR_JS_SDK", os.environ["VIKTOR_JS_SDK_PATH"] + "v1.js")
        return vkt.WebResult(html=html)
Now, let’s move to the main part, the javascript that we are using to draw a canvas and the line. Tip: ChatGPT or any other LLM you might be using is quite good at helping you get javascript to do what you want, should you (like me) not be very familiar with it.
- In the top of the file we set the styling of the canvas and the buttons
- Then we move to the actual script which uses a number of functions to:
- Draw a grid, and numbers the gridlines
- Draw points and Lines
- Find the nearest grippoint when the user clicks on the canvass
And most importantly, the function that sends back the coordinates, respectively:
- on line 26 you see we define a coordinates variable, setting the value to
INITIAL_COORDINATES. This value is replaced from the controller, filling with the current values in the parametrization table - In the
handleClickfunciton the coordinates variable is filled (lines 130 and 133) - In the
sendCoordinatesfunction the coordinates variable is sent back using theviktorSdk.sendParamsfunction - In the
clearCanvasfunction the coordinates are set back to (0, 0) and then the canvas is redrawn and the coordinates are sent back.
All combined, our example.html file looks like:
<head>
    <title>Grid Line Drawing</title>
    <style>
        body {
            display: flex;
            flex-direction: column;
            align-items: center;
            font-family: 'Segoe UI', Tahoma, Geneva, Verdana, sans-serif;
            background-color: #f0f0f0;
            margin: 0;
            padding: 20px;
        }
        .container {
            background-color: white;
            border-radius: 8px;
            box-shadow: 0 4px 6px rgba(0, 0, 0, 0.1);
            padding: 20px;
            text-align: center;
        }
        canvas {
            border: 1px solid #ddd;
            border-radius: 4px;
            margin-top: 20px;
        }
        .buttons {
            margin-bottom: 20px;
        }
        button {
            background-color: #007bff;
            color: white;
            border: none;
            padding: 10px 20px;
            margin: 0 10px;
            border-radius: 5px;
            font-size: 16px;
            cursor: pointer;
            transition: background-color 0.3s ease;
        }
        button:hover {
            background-color: #0056b3;
        }
        h1 {
            font-size: 20px;
            color: #333;
            max-width: 600px;
            text-align: center;
            margin-bottom: 20px;
        }
    </style>
</head>
<body>
    <script src=VIKTOR_JS_SDK></script>
    <div class="container">
        <h1>Draw a line in the canvas below, then click the Send Coordinates button to fill the Table on the left with its coordinates</h1>
        <div class="buttons">
            <button onclick="clearCanvas()">Clear Canvas</button>
            <button onclick="sendCoordinates()">Send Coordinates</button>
        </div>
        <canvas id="gridCanvas" width="800" height="800"></canvas>
    </div>
    <script>
        const canvas = document.getElementById('gridCanvas');
        const ctx = canvas.getContext('2d');
        const gridSize = 40;
        const pointRadius = 3;
        let coordinates = INITIAL_COORDINATES;
        let isDrawing = false;

        // This function will be called by the controller to set initial coordinates
        function setInitialCoordinates(coords) {
        setCoordinates(coords);
        redrawCanvas();
        }

        function drawGrid() {
            ctx.strokeStyle = '#ddd';
            ctx.fillStyle = 'black';
            ctx.font = '10px Arial';
            ctx.textAlign = 'center';
            ctx.textBaseline = 'middle';

            for (let x = 0; x <= canvas.width; x += gridSize) {
                ctx.beginPath();
                ctx.moveTo(x, 0);
                ctx.lineTo(x, canvas.height);
                ctx.stroke();
                ctx.fillText(x / gridSize, x, canvas.height - 5);
            }
            for (let y = 0; y <= canvas.height; y += gridSize) {
                ctx.beginPath();
                ctx.moveTo(0, y);
                ctx.lineTo(canvas.width, y);
                ctx.stroke();
                ctx.fillText((canvas.height - y) / gridSize, 5, y);
            }
        }

        function drawPoint(x, y) {
            ctx.fillStyle = 'red';
            ctx.beginPath();
            ctx.arc(x, y, pointRadius, 0, Math.PI * 2);
            ctx.fill();
        }

        function drawLine() {
            if (coordinates.length === 2) {
                ctx.strokeStyle = 'blue';
                ctx.lineWidth = 2;
                ctx.beginPath();
                ctx.moveTo(coordinates[0].x * gridSize, canvas.height - coordinates[0].y * gridSize);
                ctx.lineTo(coordinates[1].x * gridSize, canvas.height - coordinates[1].y * gridSize);
                ctx.stroke();
            }
        }

        function snapToGrid(x, y) {
            return {
                x: Math.round(x / gridSize),
                y: Math.round((canvas.height - y) / gridSize)
            };
        }

        function handleClick(event) {
            const rect = canvas.getBoundingClientRect();
            const x = event.clientX - rect.left;
            const y = event.clientY - rect.top;
            const snappedPoint = snapToGrid(x, y);

            if (!isDrawing) {
                coordinates = [snappedPoint]; // Start new line
                isDrawing = true;
            } else {
                coordinates.push(snappedPoint); // Complete the line
                isDrawing = false;
            }

            redrawCanvas();
        }

        function redrawCanvas() {
            ctx.clearRect(0, 0, canvas.width, canvas.height);
            drawGrid();
            coordinates.forEach(point => drawPoint(point.x * gridSize, canvas.height - point.y * gridSize));
            drawLine();
        }

        function clearCanvas() {
	    coordinates = [{x: 0, y: 0}, {x: 0, y:0}];
            viktorSdk.sendParams({coordinatestable: coordinates});
            isDrawing = false;
            redrawCanvas();
        }

        function sendCoordinates() {
            viktorSdk.sendParams({coordinatestable: coordinates});
        }

        canvas.addEventListener('click', handleClick);

        drawGrid();
	redrawCanvas();
    </script>
</body>
</html>
A combined working little app can be downloaded here:
demo_drawing_lines_snapping_grid.zip (4.4 KB)
In closing
Like I mentioned before, you do not necessarily need to know a lot of Javascript for this, at least I didn’t. Any AI assistant is quite good at this stuff, and combining it with this webview interaction really allows you to build almost anything you can think of! I hope to see a lot of you using this new function to build cool stuff, and hopefully you’ll show (parts of) your work here!
