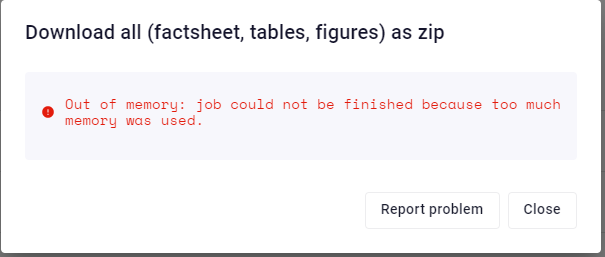
I’d like to ask a question. Previously, my VIKTOR app worked fine. Now I updated the viktor-cli and a new geolib wheel. In my development environment the tools runs fine, but now I have published it and and running the tool gives me the following error:
We are aware that sometimes there is a mismatch on local memory consumption and memory consumption in production. This is high on our priority list.
For now the most straightforward solution would be to decrease memory consumption in your application. Can you perhaps share how you generate the download? Please be sure to remove any sensitive information before posting!
Good to know this memory issue is something you are working hard on.
Unfortunately, I don’t know how I can decrease the memory consumption, nor can I easily share how the download is generated, because we make use of internal wheels. Could we please have a call?
Unfortunately, this issue is still open. I wondered if you have any updates. Also, I’d like to ask if changing the heap size settings in Pycharm be similar to setting a memory limit on the viktor app while developing?
Unfortunately, we are still in the phase of investigating a way to accurately and reliably ‘predict’ an out-of-memory error in production within the development environment. We will make sure to communicate this on the Community Forum when we deploy a solution for this.
Since a VIKTOR app is running on your system using Python directly (or within a Docker container in case you are using “docker” isolation mode), and not in PyCharm, setting the heap size in PyCharm won’t influence this.
It has been a while. I am still awaiting news on this front, so my first Viktor app can be published and run without errors. It is for automatically generating appendices with input/output for stix files. My colleagues are also eagerly awaiting the online launch of the tool. It would be very convenient for any D-Stability project. Meanwhile, I had three questions:
Do you have any updates on how to predict an out-of-memory error in production?
Do you have any tips on pinpointing which part of the code is causing the large memory consumption?
Is there any way to program around the memory error? So, for example, with try/except: try generating an elaborate appendix, except there is a memory error, generate a small appendix with the basics.
The app behaves quite well now. We could not pinpoint which of the following points is the bottleneck, but here is a list of causes of the memory error:
I would like to chime in on the memory error issue, as it is something I had to deal with in my apps. I was able to fix the issue myself by rewriting some code to use memory more efficiently, but it was a frustrating experience to troubleshoot. The only way to properly test whether the app will run into this issue, is to publish the app and run some tests on the published version of the app. As my app depends on a lot of different parameters including multiple uploadfields, you can imagine how cumbersome this debugging process is.
The suggested CLI-command to limit max-memory does not accurately reflect the published version.
A way to properly debug this issue before publishing would be incredibly helpful!