Versions
SDK: v13.2.1
Python: v3.8.13
Isolation mode: venv
Problem
I’m trying to plot a GeoDataFrame in a GeoJSONView, for which I have to convert RD New (EPSG 28992) to WGS-coordinates in order to plot the geometries correctly. The way I do this is:
if gdf.crs.to_epsg() != 4326:
   gdf.to_crs(epsg=4326, inplace=True)
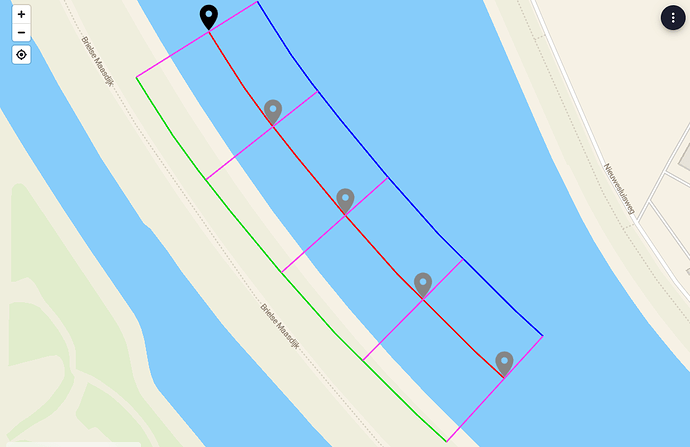
This seemed to work fine for the project location I was working on, but when moving to other locations in the Netherlands the geometries are plotted incorrectly. An example is shown below; the red center line is plotted on the water, while it should be plotted a bit more in the southwest direction on the dike.
I tried using both the GeoPandas conversion function and the VIKTOR RDWGSConverter.from_rd_to_wgs function on an example RD New coordinate pair (209790, 388237). Both resulted in approximately the same WGS-coordinates (4.23374, 51.87658) which I manually checked and is correct. So I can’t seem to figure out what the problem is.
Also when I export the shapefile and import it in GIS-software the location is correct. So is it a VIKTOR visualization bug?
