where icon can be equal to a square, a circle or triangle.
I’m trying to change the size of the icons, since they appear quite big on the map. I cannot find anything about it in the documentation.
Also, I want to add a legend, to explain the different icons and colors. In the documentation, it looks like I can only explain colors with MapLegend. Is this true?
It’s currently not possible to set a specific size for the icon, only for labels on the map. Is this something that is limiting for you? Can you give me some more background about what it is you want to do that you currently cannot? The icon scales with zoomlevel. Perhaps you can try some different icons, open and/or closed versions of icons etc. to get your desired result.
For a legend you can indeed use a MapLegend, is there anything you need to do with the legend that you cannot?
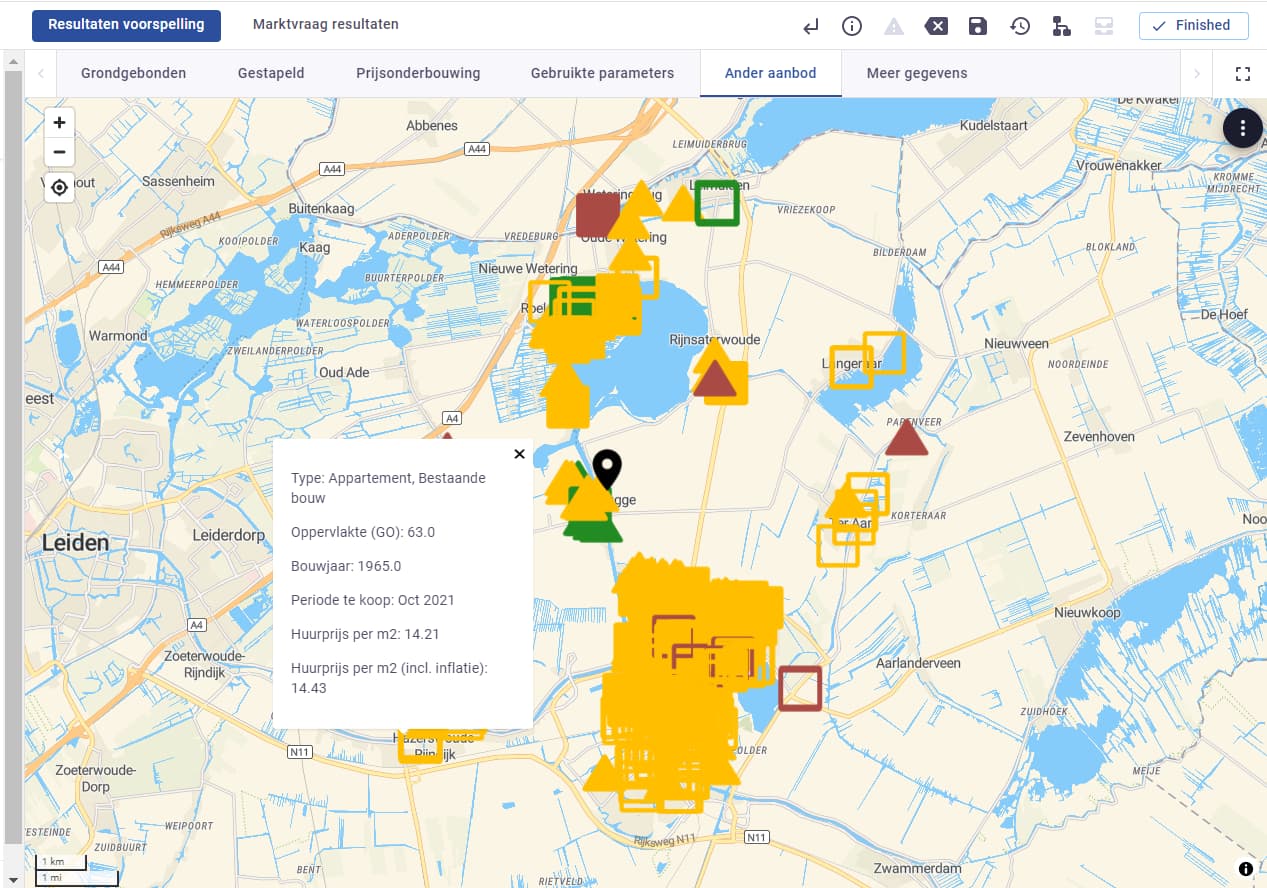
We want to show some recently sold houses on a plot, with different icons per type of house (so rent/sale and ground bound/ stacked). But there can be a lot of houses in a certain city for instance, which results in a very messy view. Ideally, we of course want to group the icons, when there are too many in one area (like you also see on the map of Funda), but I suppose that is a step too far for now.
For the legend, we want to explain the icons, so ‘square’ = ground bound properties and ‘traingle’ = stacked properties. But this seems to be impossible, since you can only explain colors in de MapLegend instead of icons.
The resulting view you posted is indeed a cluttered, I can imagine it not being the desired result. As an alternative, I think it might be possible to build something that is more useful using a slightly different flow. Bear in mind that I am only trying to generate some ideas here, I don’t really know if these options will be useful to you. So, in no particular order:
Perhaps the user should go to the desired zoomlevel, and then draw an area on the map in which the icons should be shown. You could use the GeoPolygon to get the coordinates of an area drawn by the user, and then only show icons within that region
You could try to get the “grouping” as you call it by determining the distance between a point and it’s neighbors, then grouping if that distance is too small. Perhaps give the user a “Refine” ToggleButton to switch that on and off
You could first draw a GeoPolygon per property-type, in different colors. Using the MapView interaction see this link you could then let the user select one or more polygons at a time and draw the icons falling inside that polygon.
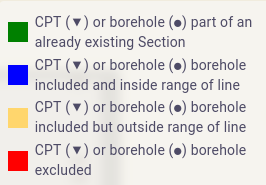
I think you can still make use of the legend, albeit with a small workaround:
You can color code the icons, e.g. green square = ground bound properties, red triangle = stacked properties. Then the colors would already distinguish the icons.
Furthermore: you are free to use unicode symbols in the legend. E.g.: u25B2 is the unicode for a black triangle pointing up (see this link for examples). So you could do something like:
which is of course a logical place, but the good old SDK Reference page is my “go to” page. So I would appreciate it if it is also added there (of course if it’s not too much trouble)!
I wanted to let you know that we are still struggling with adding icons, images or headers in the legend. It is difficult to make a clear explanation of what you see in the map, if the legend is very limited.
Sorry to hear it’s still a struggle. Is this while still using the mapview or geojsonview?
I’m wondering, have you looked into using a map in a webview? Through packages like folium (Folium — Folium 0.19.1 documentation) or even using javascript in a webview directly in combination with leaflet (https://leafletjs.com/) you are probably able to do way more custom things.
With the addition of webview interaction (Results & visualizations - HTML | VIKTOR Documentation) this has become a much more powerful option, because you can send back data from the webview into your app’s parametrization (and by extension into your logic).
Hi @rweigand thanks for your suggestions! We are mostly using Geojsonviews. It might be a good idea to change some maps to folium! However, on some maps, we use the GeoPolygonField and GeoPointField. Those fields requires a mapview/geojsonview, so we cannot change them.