Hi Everyone, I have one general idea to define some geometry in Map View (e.a. polygon - with coordinates and then use this polygon in Geometry View - 3D). Is it possible to integrate this two types of views together? So bring the map space to Geometry View? So axis in Geometry View will have map coordinates - e.a. make “Scene (3D) View” from Geometry 3D View.
Hi @Marian,
Welkom to the community.
Points you select on a map are points on a sphere. So they are ‘Spherical coordinates’. Spherical coordinates can be converted to cartesian coordinates using:
x = RADIUS * cos(geo_point.lat) * cos(geo_point.lon)
y = RADIUS * cos(geo_point.lat) * sin(geo_point.lon)
z = RADIUS * sin(geo_point.lat)
So using this you can draw some points (spheres) and lines (cilinders) in the 3D geometry view. Here is a VIKTOR example that does this:
from math import cos, sin

from viktor import ViktorController
from viktor.geometry import Point, Polygon, Group, Sphere, Line, CircularExtrusion
from viktor.parametrization import ViktorParametrization, GeoPolygonField, ToggleButton
from viktor.views import MapView, MapResult, GeometryView, MapPolygon, GeometryResult

RADIUS = 6371  # km


class Parametrization(ViktorParametrization):
    geo_polygon = GeoPolygonField("Map Polygon")


class Controller(ViktorController):
    label = 'My Entity Type'
    parametrization = Parametrization

    @MapView("Map", duration_guess=1)
    def map_view(self,params, **kwargs):

        features = []
        if params.geo_polygon is not None:
            map_polygon = MapPolygon.from_geo_polygon(params.geo_polygon)
            features.append(map_polygon)

        return MapResult(features=features)

    @GeometryView("Scene (3D) View", duration_guess=1, x_axis_to_right=True)
    def geometry_view(self, params, **kwargs):

        geo_polygon = params.geo_polygon

        # convert GeoPoints (lat/long) to geometry points (x,y,z) and add spheres to the geometry view
        points = []
        geometry_objects = []
        for geo_point in geo_polygon.points:

            x = RADIUS * cos(geo_point.lat) * cos(geo_point.lon)
            y = RADIUS * cos(geo_point.lat) * sin(geo_point.lon)
            z = RADIUS * sin(geo_point.lat)

            point = Point(x, y, z)
            points.append(
                point
            )
            # draw sphere at the points
            geometry_objects.append(
                Sphere(centre_point=point, radius=10)
            )

        # draw 'lines' between points
        for point1, point2 in zip(points, points[1:]):
            line = Line(point1, point2)
            cilinder = CircularExtrusion(10, line)
            geometry_objects.append(cilinder)

        # draw line between last point and start point to close 'polygon'
        geometry_objects.append(
            CircularExtrusion(10, Line(points[-1], points[0]))
        )

        return GeometryResult(Group(geometry_objects))
In this example you can select an polygon on the map view. The polygon is then converted to a 3d object in the GeometryView
In the GeometryView, you can click the 3 dots and select ‘Center camera’ to get the polygon in view.
Is this wat you where looking for in 3d?
Hi @mweehuizen,
thank you a lot for your very fast response. I tryed to implement your solution in app and I understand to your idea. Your solution is transform coordinates from map service (global coordinates) to plane. I suppose, that map service in MapView used WGS84 coordinate system with some reference area (Auxilliary sphere, e.a.). I looked to console of web browser and it showed me some tile service hosted in viktor ai environment. Am I right with used coordinate/reference system of used map service?
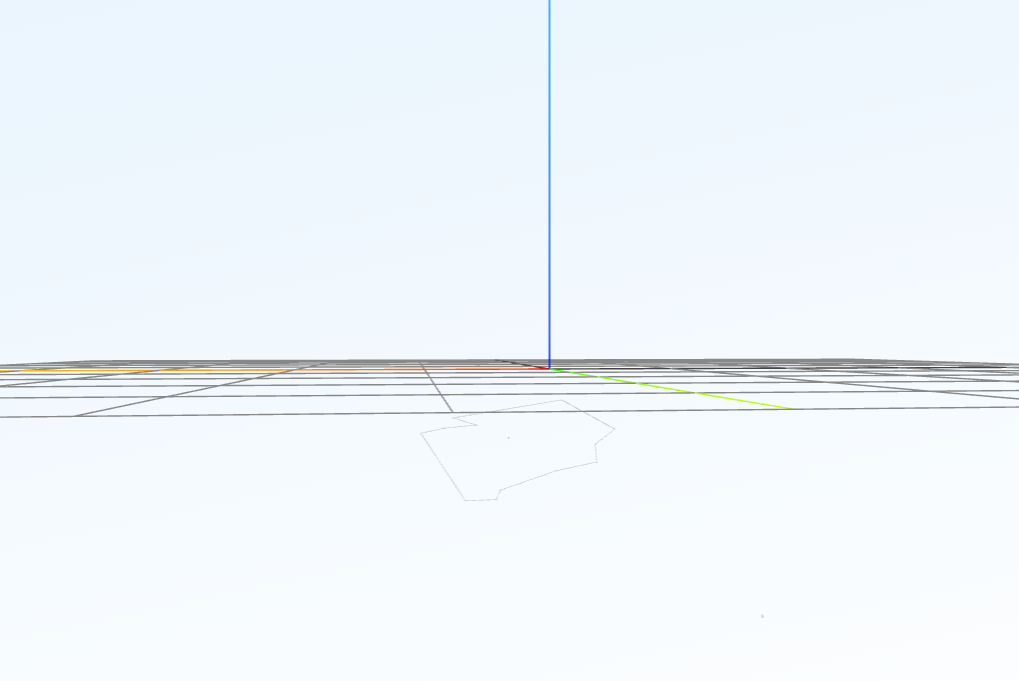
My result is quite weird in Z coordinates, where Z dimension is not in plane (map area is not wide acording to sphere surface). I think I will need to implement some additional transformation calculation to get geometry in plane without distortion from global position system to plane reference. Or I do something wrong.
This is defined area in MapView (area of Prague - over 30 km in width):
And this is result in GeometryView:
Thanks @mweehuizen,
your idea was usefull for me. I found, that calss “GeoPolygonField” from your script returnes array of vertexes (.lon and .lat in WGS84 format EPSG: 4326). I changed your calculation formula and use conversion from EPSG: 4326 to EPSG: 3857 - which is WebMercator (AuxSphere) with coordinates X,Y:
from math import pi, tan, log
r = 6378137.0 # RADIUS
phi = geo_point.lat/180pi
lamb = geo_point.lon/180pi
x = r * lamb
y = r * log(tan(pi/4 + phi/2))
so service in MapView has EPSG:3857 but class attributes .lon, .lat returns coordinates in EPSG: 4326 and when you want to use its in GeometryView, its needed to convert it instead of that.
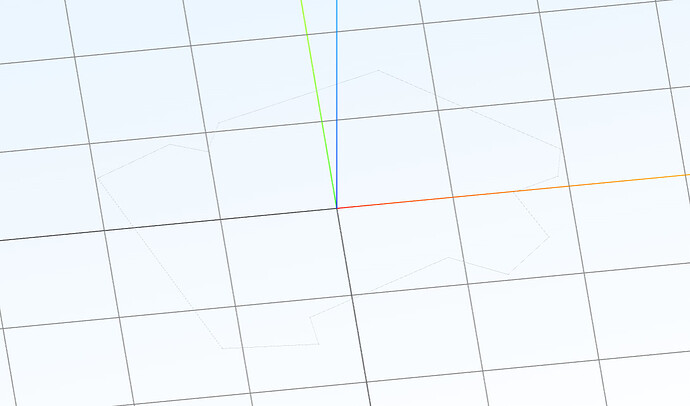
Result is without distortion:
Z coordinates map view seems dont offer
Thank you for your help.
Wow great solution.
I am not that familiar with al the different CRS available.
I was not aware that you wanted to transform the area into 2D (I kept it in 3D). Which looked a bit weird indeed. Bit great job with the transformation.
It might be nice to put the 2D shape in PlotlyView instead of the GeometryView. I finf that view nicer for 2D plots.
greetings,
Maarten


