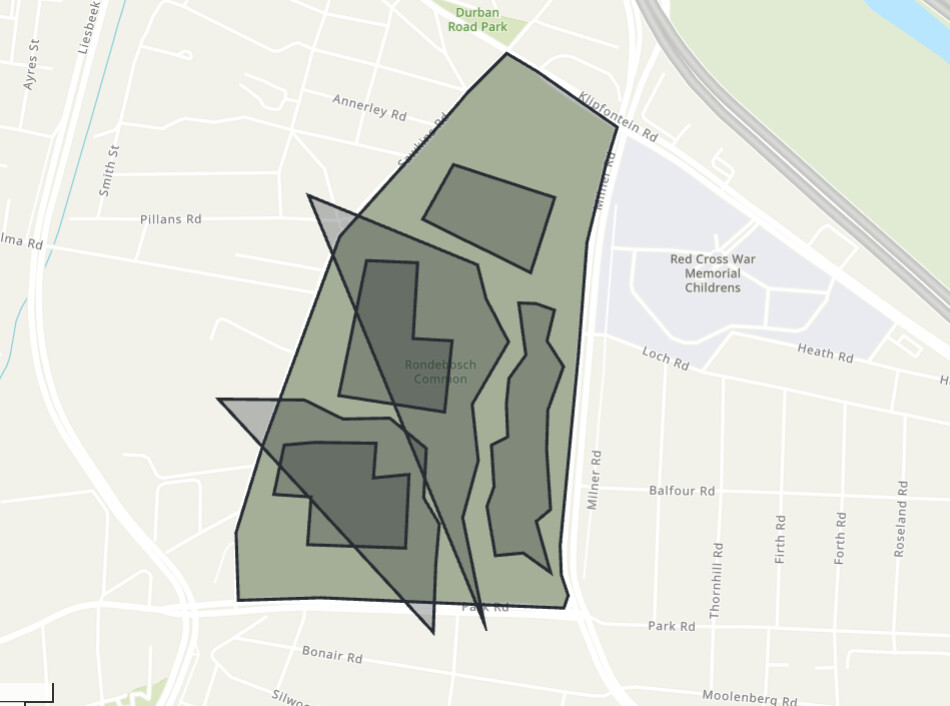
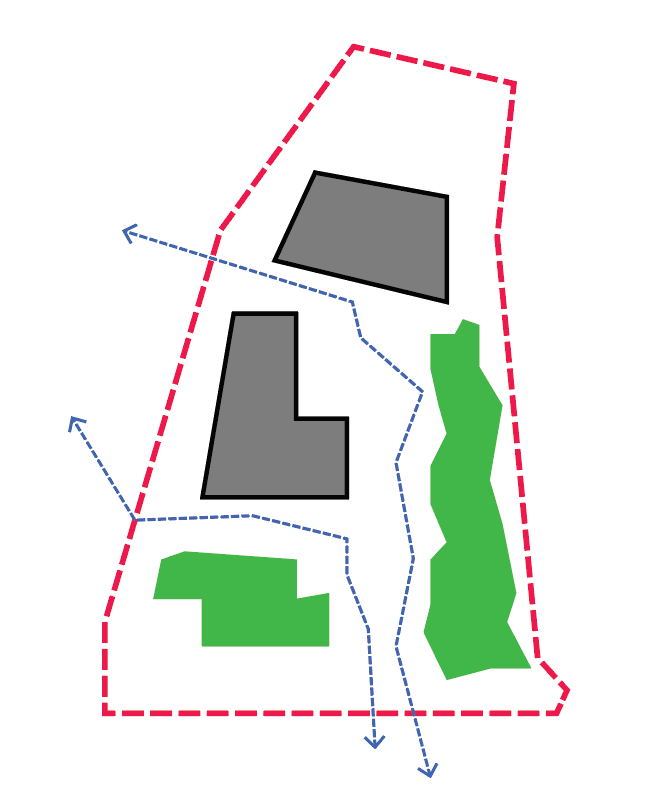
Background: When using Viktor for urban design applications, distinguishing between various features like landscaping zones, building zones, and movement routes is crucial. Currently, all these features are represented in grey, making differentiation a challenge, especially when multiple features are drawn. See attached screenshots for current Viktor map view and an example created in Adobe Illustrator.
Requested Features:
Customizable Graphics for Map Features:
Line Weights: Allow users to adjust the line weights of different features.
Colors: Provide options to customize the color of each feature.
Line Style: Introduce varied line styles (e.g., solid, dashed) to further differentiate features.
Distinguish GeoPolylineField from GeoPolygonField:
The current representation makes it difficult to tell these two apart. A suggestion would be to represent GeoPolylineField objects as open polylines.
Hover Interaction:
Highlighting on Map: When the pointer hovers over a specific map feature, its corresponding input should be highlighted.
Highlighting on Inputs: Conversely, hovering over an input should highlight the related map feature, making the connection between input and graphical representation explicit.
Benefits: These modifications would not only improve user experience and the precision of urban designs but also streamline user interaction with the tool. The intuitive hovering mechanism would reduce the time spent searching for corresponding features and inputs, making design tasks more efficient.
Thanks for posting your feature request. This is something that we are actively trying to improve, therefore it is great to get your input. There are, however, some items that I think are already possible.
Customizable Graphics for Map Features:
Line Weights: I think this is something we have on our radar, so good to get confirmation on this.
Line Style: This is something we will need to look into to see whether we can make this possible.
Distinguish GeoPolylineField from GeoPolygonField: Could it be that you are using a MapPolygon for both cases? Here is the reference for a MapPolyline feature, compared to the MapPolygon
Hover Interaction: Is this only specific for map interactions (for the case of actively selecting objects for input), or in general if you want to see information?
Thanks for the response.
Sorry, I was retrieving the Polylines as MapPolygons instead of MapPolylines. Now fixed with:
        # Add the movement routes to the map features list.
        if params.tab_2.section_5.movement_route_1:
            features.append(MapPolyline.from_geo_polyline(params.tab_2.section_5.movement_route_1))
Thanks, I will have a look at the colours.
Regarding the hover interactions, my initial reference was to map interactions specifically. However, I believe integrating this feature into other views could be beneficial. For example, in the GeometryAndDataView, it might be intriguing to introduce different elements as layers. When selected, these elements could highlight corresponding outputs and, if needed, display additional metadata through popups.
Such an enhancement would significantly enrich the user experience. So yes, a general application of hover/click interactions would be great. You can see similar interactions when viewing BIM objects on Speckle. Have a look at this link Speckle
Hi @Bayo,
Regarding the popups for a MapPolygon. In the meantime, you can add a description to MapPolygon, this will open a small window in which you can display some extra information about that area. Ofcourse it is not the ideal solution but at least you can attach some extra information to your map elements to inform your user.
Hope this helps somewhat overcome the limitations!
Dear @Bayo, the latest platform version now has support for the attributes you requested:
fill-opacity
stroke-opacity
stroke-width
dash-size
gap-size
A full list of the currently supported attributes can be found in the documentation.
Currently these new attributes can only be used in the GeoJSONView, but will probably also be added as possible inputs in the MapFeatures for the MapView.